









Midsummer Musings: What Will the 2nd Half Bring?
What’s ahead in the second half of the year for lending, investment volume and the business climate? A senior NAR economist sheds light on the complex issues that will shape the rest of 2017.
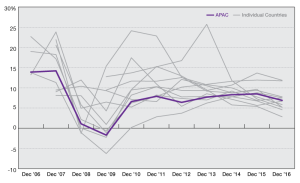
Asia Pacific vs. Other Global Markets
The Asia Pacific region has some of the most diverse real estate markets in the world. Alongside more established markets like Australia and Japan, there are a number of more nascent markets with lower transparency, higher barriers to entry and at various stages of development.
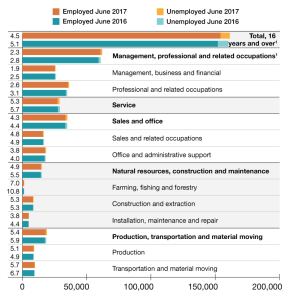
Employment Picture
Year-over-year, the largest difference for employment was in the Professional and Related occupations with a rise of 4.6 percent.
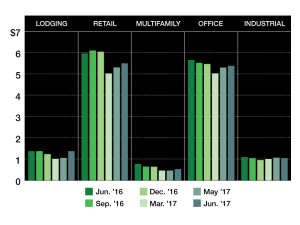
CMBS Delinquencies
Delinquencies continued to drop year-over-year as of June 2017, except for the lodging sector, which increased by $1 million.
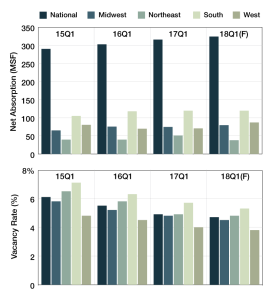
National Vacancies
Vacancy rates year-over-year decreased in all regions, with the largest change coming from the Northeast, which tightened to 4.9 percent from 5.8 percent in the first quarter of 2017.
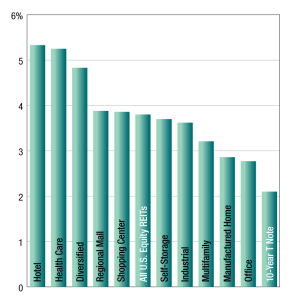
REIT Dividend Yields
The hotel sector posted the highest one-year average dividend yield among the group, at 5.3 percent, outperforming the broader SNL U.S. REIT Equity Index by 1.5 percentage points.
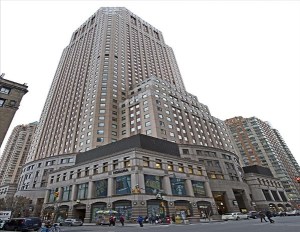
Top 5 Retail Space and Office Building Sales
PropertyShark compiled the top 5 sales in office and retail for June 2017 in New York City.
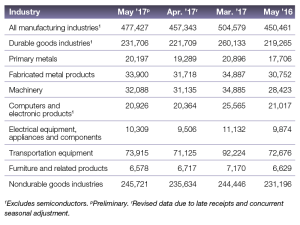
Industrial Demand
Compared to April 2016, new orders increased for all industries except for Furniture and Related Products, which went down by 2.1 percent.
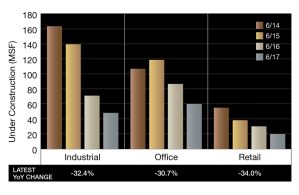
Development
Compared to May 2017, the percentage of industrial properties under construction decreased by 11.9 percent, followed by a decrease of 7 percent for office construction.
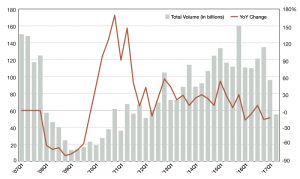
CRE Transaction Volume and Percent Change
The volume has ranged over the past 10 years from $13.2 billion in the first quarter of 2009 to $160.2 billion in the fourth quarter of 2015.
You must be logged in to post a comment.