

Finance (Research Center)
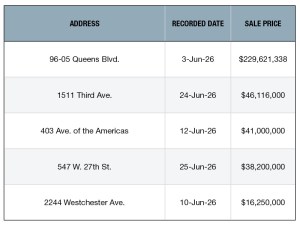
Top 5 NYC Retail Building Sales—June 2026
This month’s roundup includes a $229.6 million deal in Queens.
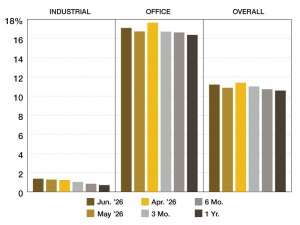
2026 Special Servicing Rates
Data from Trepp’s latest report. Find out more.
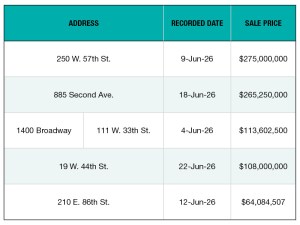
Top 5 NYC Office Building Sales—June 2026
The five largest transactions in New York City include the $275 million sale of 250 W. 57th St.
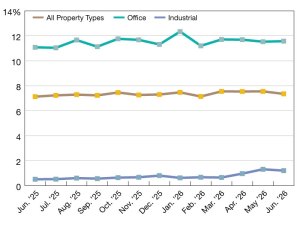
2026 CMBS Delinquency Rates
Trepp’s latest data on CMBS delinquency rates. Read the report.
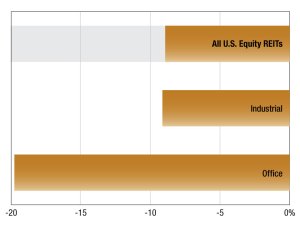
2026 REIT Trading Trends
The latest update from S&P Global Real Estate on REIT trading trends. Read the report.
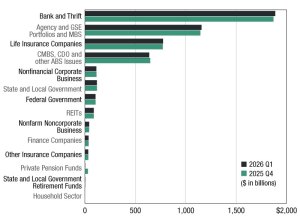
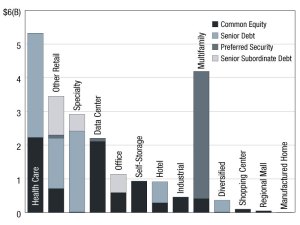
Commercial and Multifamily Mortgage Debt Outstanding Crossed $5T in Q1
The milestone reflects the resiliency and depth of commercial markets.
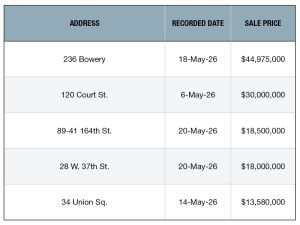
Top 5 NYC Retail Building Sales—May 2026
PropertyShark collected the largest retail transactions in New York City.
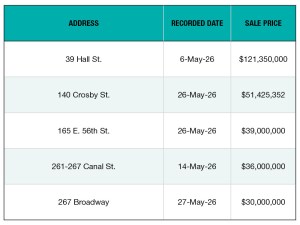
Top 5 NYC Office Building Sales—May 2026
These are the five largest transactions in New York City, collected monthly by PropertyShark.
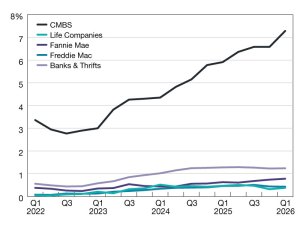
Commercial and Multifamily Mortgage Delinquencies Remained Mixed in Q1
While overall loan fundamentals remain relatively healthy, trends varied across capital sources.