

Research Center
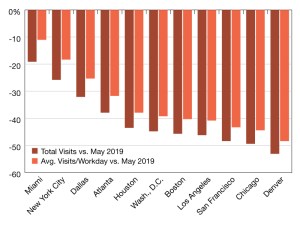
2026 Placer.ai Office Index
The latest data on national and local office foot traffic trends.
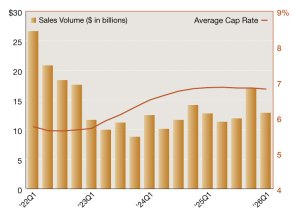
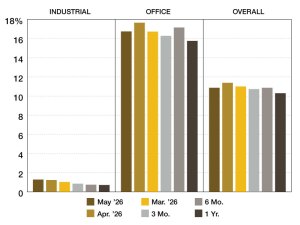
2026 Single-Tenant Net Lease Sales Volume & Cap Rates
Top trends impacting the market, according to Northmarq.
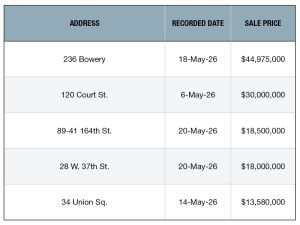
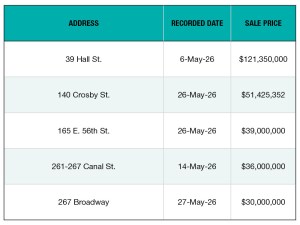
Top 5 NYC Retail Building Sales—May 2026
PropertyShark collected the largest retail transactions in New York City.
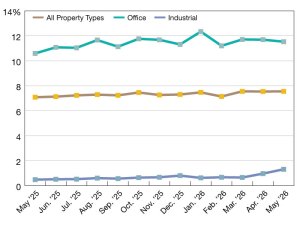
2026 Special Servicing Rates
Data from Trepp’s latest report. Find out more.
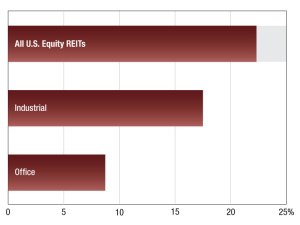
2026 Commercial REIT Values
S&P Global Intelligence’s latest snapshot of REIT performance. Read the report.
Top 5 NYC Office Building Sales—May 2026
These are the five largest transactions in New York City, collected monthly by PropertyShark.
2026 CMBS Delinquency Rates
Trepp’s latest data on CMBS delinquency rates. Read the report.

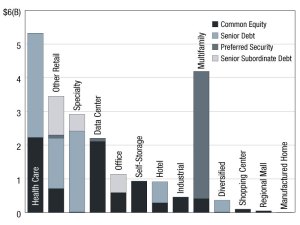
Falling Office Vacancy Contrasts With Rising Distress
Large office properties continue to face pricing challenges as investors favor amenity-rich assets, Yardi Matrix data shows.