


Office Sale Prices Surge, Volume Holds Steady
The latest snapshot of national deal trends from Yardi Matrix.
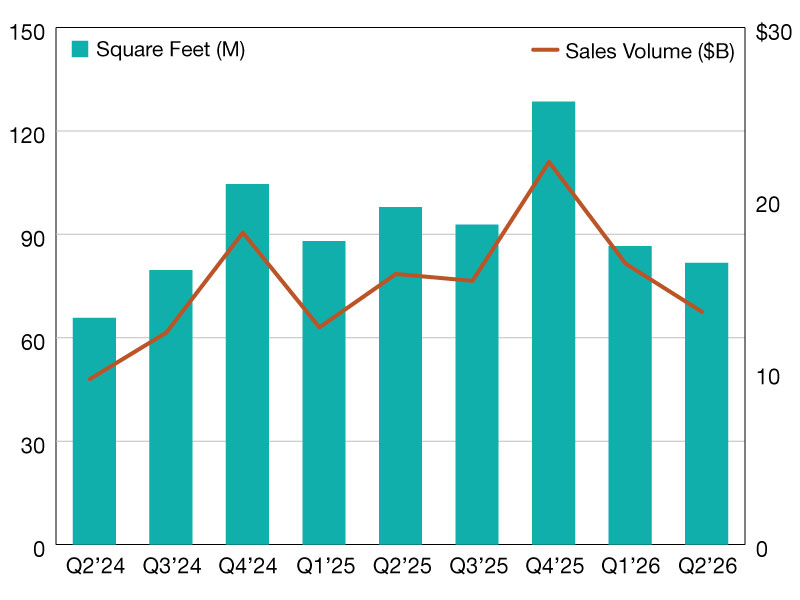
The second quarter of 2026 closed with $13.5 billion in office investment volume, as investors closed 557 transactions, according to the latest Yardi Matrix data. These deals involved 81.7 million square feet of space selling at $179.52 per square foot on average.
Total sales volume declined by 17.2 percent compared to the previous quarter. Pricing also took a tool—a 15.1 percent decrease, while the amount of office space sold decreased slightly by 5.7 percent.
At the end of the year’s first three months, office deals totaled $16.3 billion across 733 transactions. That quarter also recorded more office space changing ownership at higher prices, as 86.6 million square feet sold for $211.49 per square foot.
Investment volume declined by 14 percent, while pricing slightly rose with 2.4 percent at the end of 2026’s second quarter when compared to the same period from 2025.
Despite more square feet selling at the end of 2025’s second quarter—97.9 million square feet specifically—that quarter closed with 776 sales generating $15.7 billion.
Year-to-date in 2026, the U.S. office sector recorded 1,296 transactions closed. Roughly 170 million square feet sold at $195.31 per square foot on average, generating a total of $30 billion in total investment.—Posted on April 30, 2026
—Posted on July 29, 2026
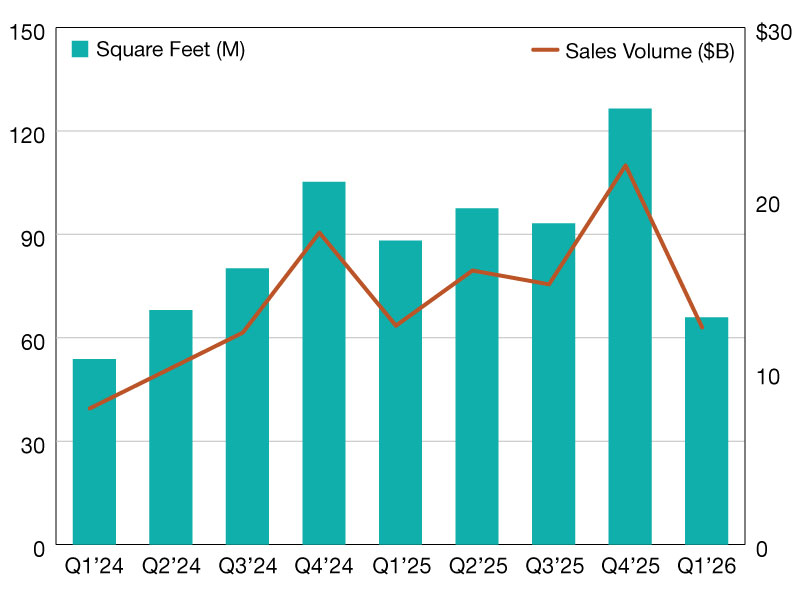
The first quarter of 2026 closed with $12.6 billion in office sales across 541 transactions, according to the latest Yardi Matrix data. These investments included 65.9 million square feet of space sold at an average of $219.99 per square foot.
Total dollar volume declined by 0.8 percent compared to the first quarter of 2025. Back then, investors closed $12.7 billion across 704 transactions. That quarter recorded higher transaction volume by square footage, with 88.2 million square feet trading at more affordable prices.
At the end of the first quarter of 2026, office prices rose 30 percent year-over-year from 2025’s $168.85 per square foot during the same period. This translates into less space trading at higher values.
The price gap becomes even larger when looking at first-quarter sale prices from 2024, when office properties sold at $158.48 per square foot—marking a 39 percent increase over two years.
Office prices surged in 2025
There were 3,392 deals in 2025, encompassing 405.4 million square feet and generating $65.6 billion. Properties sold at an average of $179.65 per square foot. Overall, 2025 closed with a 36 percent higher dollar volume than 2024’s $48.3 billion.
So far in 2026, the sector has posted 549 transactions involving 66.8 million square feet. This generated $12.8 billion in office sales, with properties changing hands at $220.11 per square foot. Despite ongoing struggles in the sector, office prices may continue to rise as owners and capital providers are preserving asset values and competitiveness.
—Posted on April 30, 2026


You must be logged in to post a comment.