CRE Transaction Volume and Percent Change
The volume has ranged over the past 10 years from $13.2 billion in the first quarter of 2009 to $160.2 billion in the fourth quarter of 2015.
Based on properties and portfolios of $2.5 million and greater
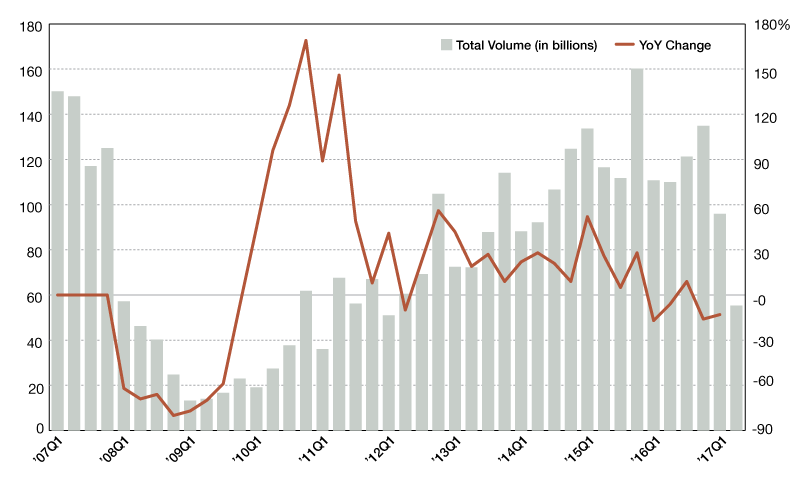
Source: Real Capital Analytics Inc., www.rcanalytics.com, 866-732-5328
The transaction volume across all the major property types totaled $55.2 billion in the second quarter of 2017, 42 percent less than the total in the first quarter of 2017 ($95.9 billion) and down by 49.8 percent on a year-over-year basis. The volume has ranged over the past 10 years from $13.2 billion in the first quarter of 2009 to $160.2 billion in the fourth quarter of 2015. Meanwhile, its year-over-year growth has shown a tendency toward decrease: In the fourth quarter of 2010, transaction volume almost tripled year-over-year, rising from $23 billion to $61 billion. But in the first two quarters of 2017, total transaction volume was $151 billion, 31.5 percent less than the value of $220.7 registered for the first two quarters of 2016, showing a decreasing tendency.


You must be logged in to post a comment.