

Property Metrics
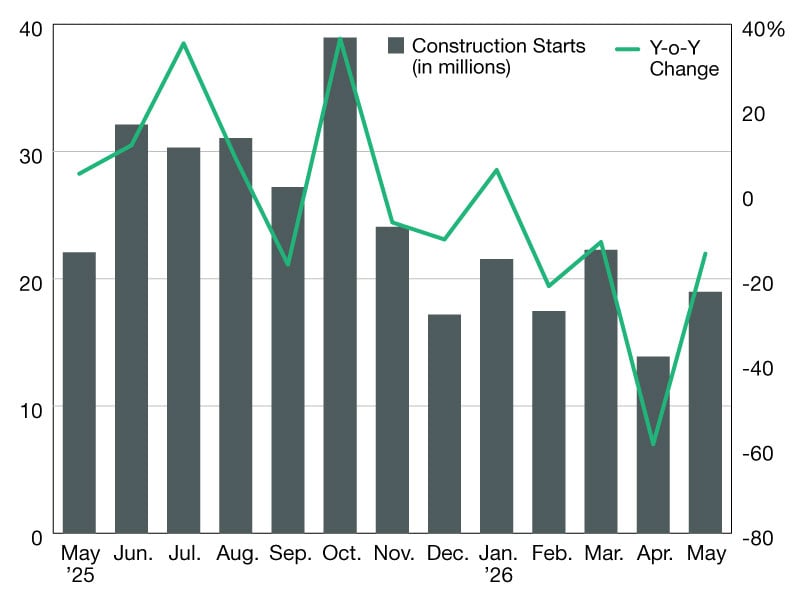
Industrial Construction Starts Remain Volatile Amid Slowdown
The trend points to moderating development volume and weakening year-over-year comparisons.
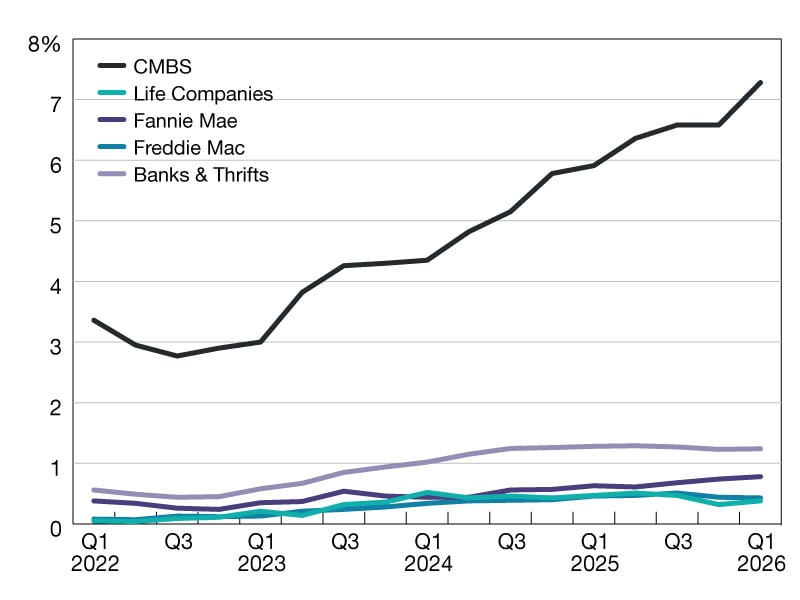
Commercial and Multifamily Mortgage Delinquencies Remained Mixed in Q1
While overall loan fundamentals remain relatively healthy, trends varied across capital sources.
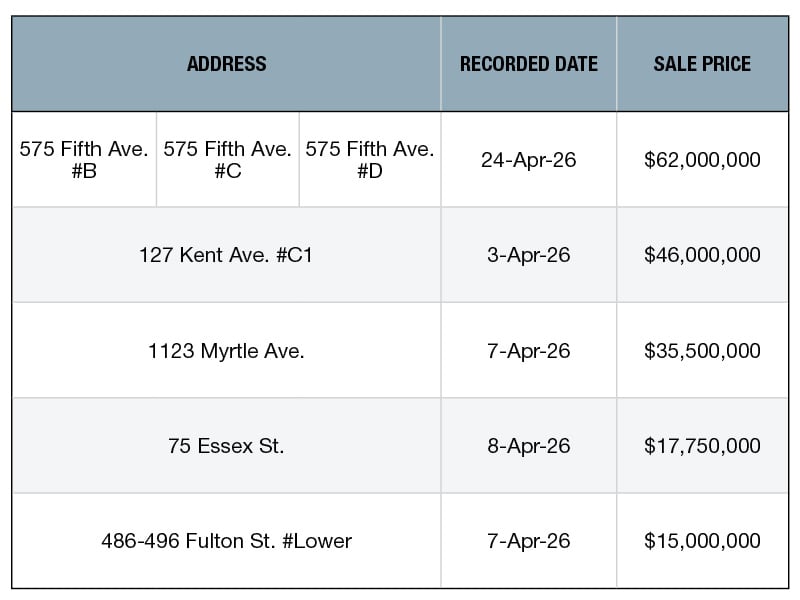
Top 5 NYC Retail Building Sales—April 2026
These are the largest retail transactions in New York City, collected monthly by PropertyShark.
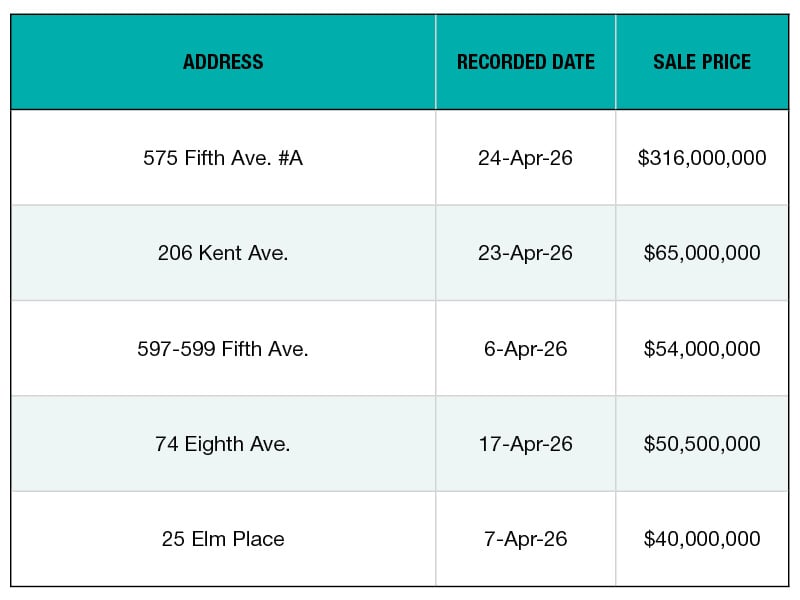
Top 5 NYC Office Building Sales—April 2026
PropertyShark collected the largest office transactions in New York City.
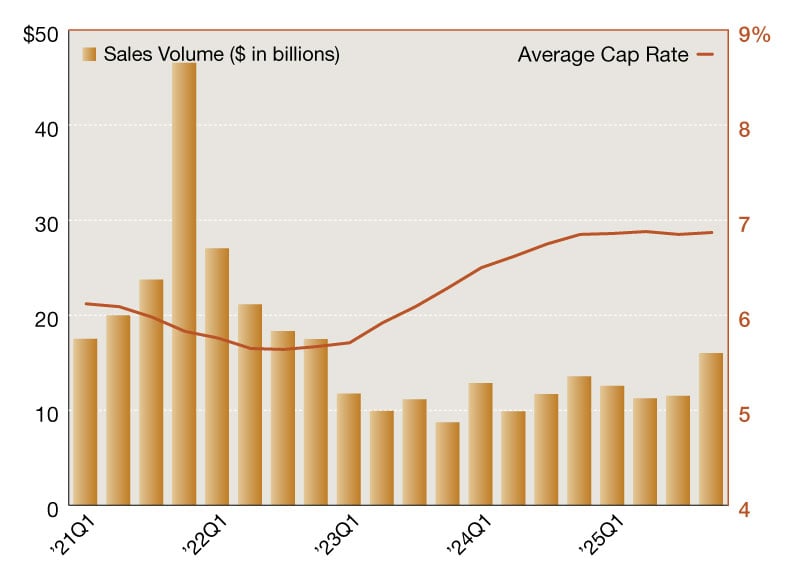
2025 Single-Tenant Net Lease Sales Volume & Cap Rates
Top trends impacting the market, according to Northmarq.
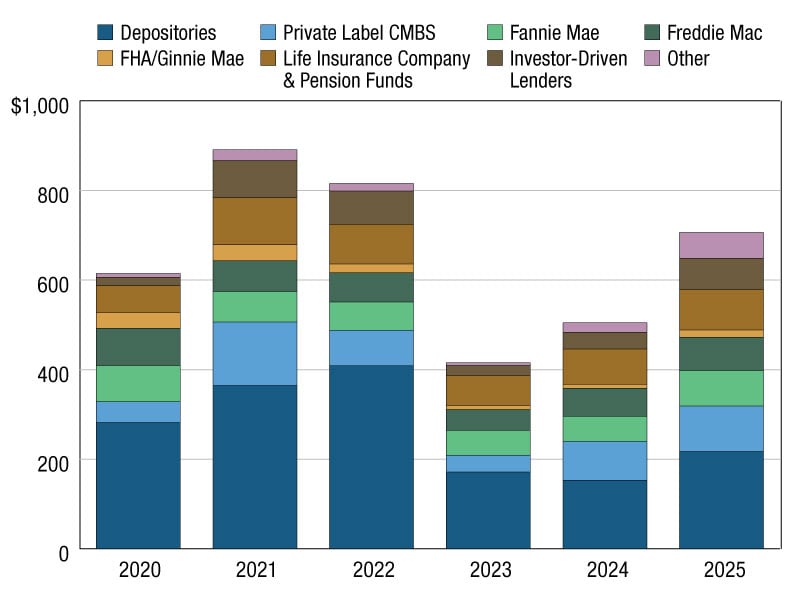
Commercial Real Estate Lending, Borrowing Jumped 40% in 2025
MBA’s analysis shows a “meaningful rebound” as capital markets stabilized.
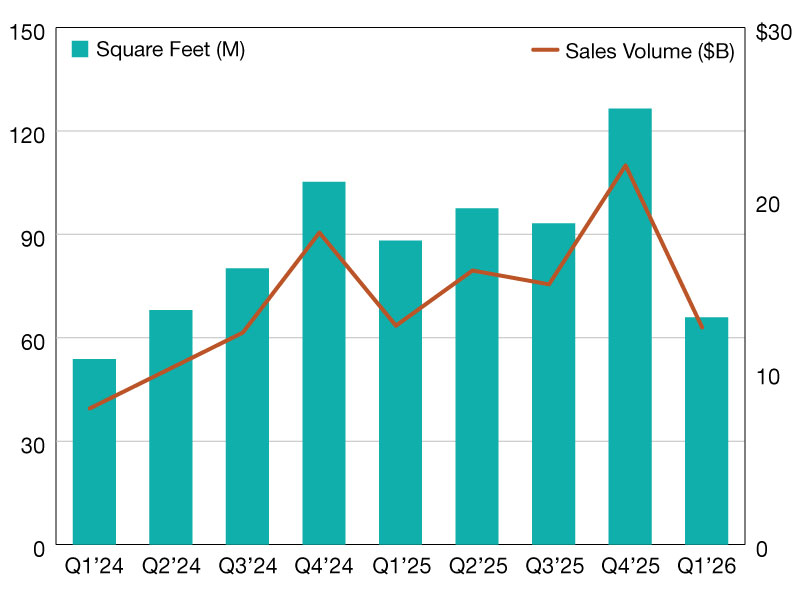
Office Sale Prices Surge, Volume Holds Steady
The latest snapshot of national deal trends from Yardi Matrix.
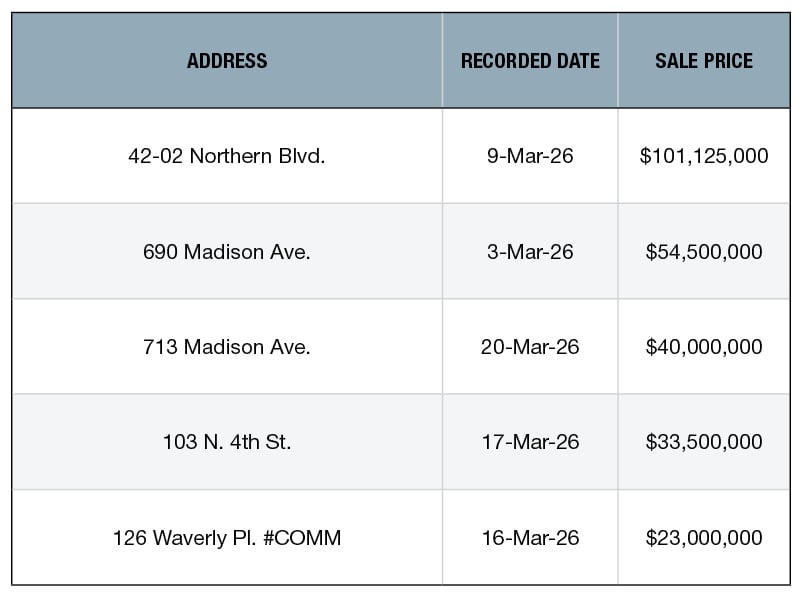
Top 5 NYC Retail Building Sales—March 2026
A roundup of the largest retail transactions in New York City, rounded up monthly by PropertyShark.
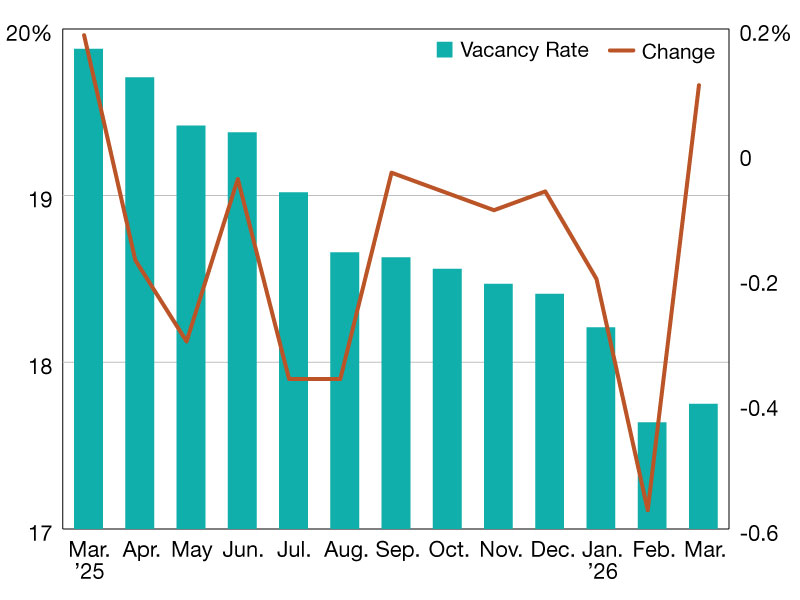
2026 Vacancy Update
The latest data shows a significant year-over-year improvement, according to Yardi Matrix.