

Industrial Starts Collapse by Year-End
Groundbreakings have witnessed a major drop over the last 12 months, according to Yardi Matrix data.

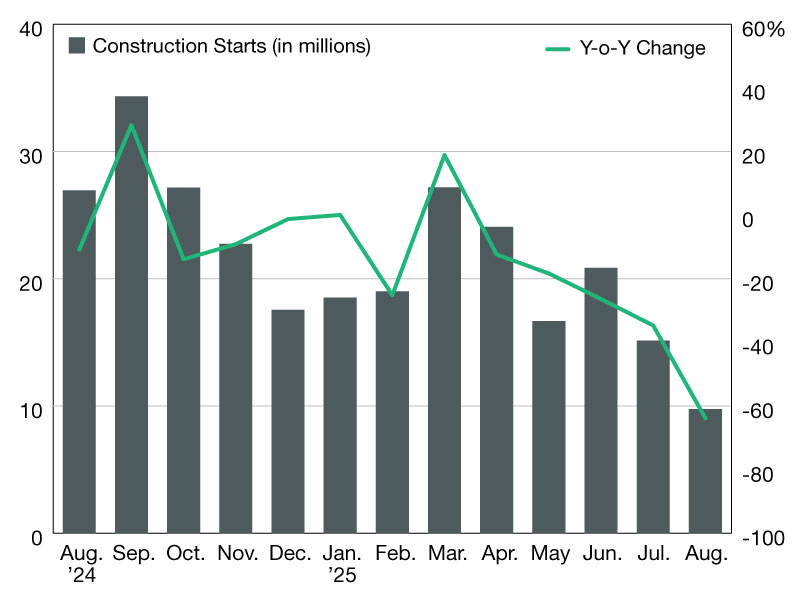
Industrial construction starts moved from resilience to retrenchment over the past year, with the 2025-to-2024 comparison underscoring the depth of the slowdown, Yardi Research Data shows.
Last year in November, developers broke ground on 22.9 million square feet of industrial space—a figure that, while softer than prior years, still reflected a historically active market. Meanwhile, in November 2025, starts collapsed to just 8.7 million square feet, marking a 62 percent decline.
READ ALSO: What’s in Store for Industrial Real Estate in 2025 and Beyond
Seasonal trends reveal how this reversal unfolded. During winter 2024 (December 2023 through February 2024), developers broke ground on roughly 62 million square feet of new projects. One year later, winter 2025 was almost on par with 60 million square feet of starts, a slight 3.2 percent decline when compared seasonally.
Spring momentum meets a turning point
Despite rising construction costs, developers remained optimistic. March through May 2024 totaled about 74.8 million square feet, while the same period in 2025 surged to 77.7 million—a 3.9 percent gain. April was the strongest month of 2025, at 30.5 million square feet. Yet May’s sharp drop to 19.2 million square feet marked a turning point, as financing tightened and speculative projects slowed.
Summer offered only temporary stability. Starts reached 80.8 million square feet in 2024 and 80.3 million in 2025, down 0.6 percent year-over-year. The real shift came in fall. September through November 2024 totaled about 83.7 million square feet of industrial construction starts. In 2025, that figure plunged to 49.6 million—a 40.7 percent decline. November’s 8.7 million square feet stands out as the weakest monthly print in years.
—Posted on December 30, 2025
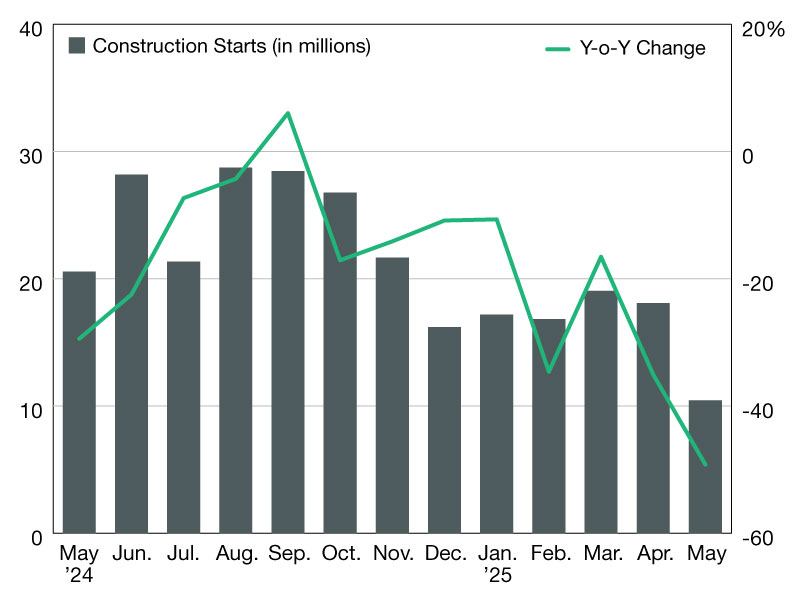
The summer months of 2025 marked a decisive slowdown in industrial construction starts, totaling 45.8 million square feet, Yardi Matrix data shows. That’s 41.7 percent below the 78.5 million square feet recorded in summer 2024 and 48.5 percent lower than 2023’s elevated 88.8 million square feet during that same period.
The decline was steady month to month—June 20.9 million square feet, followed by July’s 15.1 million square feet and 9.8 million square feet in August—a clear contrast with summer 2024’s stronger cadence (June 28.3 million square feet, July 23.2 million square feet and August 26.9 million square feet).
Earlier this year, activity was steadier: industrial construction starts totaled 68 million square feet in spring, only 4.0 percent less than 70.8 million square feet recorded in spring 2024, as a strong March (27.2 million square feet) helped offset a softer May (16.7 million square feet). The year began on cooler footing though: winter (December 2024–February 2025) posted 55.1 million square feet, down 10.7 percent from 61.7 million square feet in winter 2024.
2025 breaks the seasonal pattern
Read across the seasons, 2025 steps down from a relatively firm spring into a pronounced summer contraction, with early fall activity tracking well below prior years, according to Yardi Matrix data. Each season underperformed its 2024 counterpart, with the most dramatic shift concentrated in summer.
The monthly cadence reinforces the slowdown, while fall 2024’s 84.3 million square feet—slightly above fall 2023’s 83.3 million square feet, or up 1.1 percent—underscores how much softer the current early-fall print is. Where 2023 stands out is on the high side: spring and summer marked late-cycle peaks not matched in 2024 or 2025.
—Posted on September 30, 2025
Industrial construction starts saw a significant slowdown from 2024 to 2025. In 2024, industrial construction activity demonstrated both growth and volatility. Some months recorded strong performances—such as April with 27.85 million square feet of starts—but the overall trend pointed toward deceleration as the year progressed. Several months, including May, July and December, posted year-over-year declines exceeding 20 percent, signaling a cooling development pipeline.
READ ALSO: NAIOP Special Report: Will Tariffs Tax CRE’s Industrial Sector?
The tapering became more evident at the start of 2025. January saw industrial construction starts fall to 17.2 million square feet, down 26.9 percent compared to the same month in 2024. February and March continued this trajectory, with starts declining by 34.6 percent and 16.2 percent year-over-year, respectively. By May 2025, the volume had dropped to just over 10.4 million square feet—a steep 42.2 percent decrease from May 2024.
This steady contraction marks a significant shift from the robust activity seen the year prior. The consistent, double-digit year-over-year decreases throughout the first five months of 2025 suggest a meaningful slowdown in developer activity, possibly driven by shifting market conditions or a recalibration after years of aggressive growth. The data points to a more cautious, restrained industrial development pipeline taking shape in 2025.
—Posted on June 27, 2025
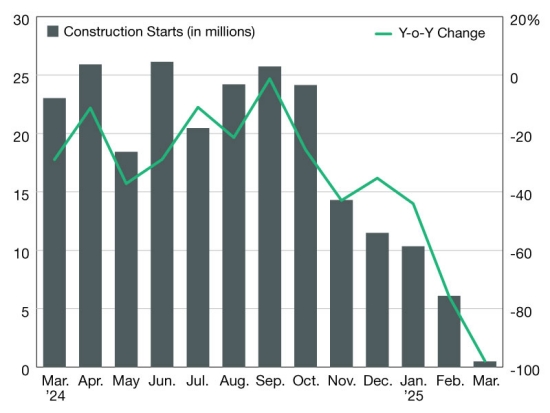
Industrial construction starts saw a dramatic slowdown at the beginning of 2025, with sharp year-over-year declines highlighting the sector’s cooling momentum. In February, new project starts totaled just 6.1 million square feet—a staggering 75.8 percent year-over-year drop from the 25.2 million square feet recorded in February 2024.
January also saw a steep contraction, with industrial construction starts falling to 10.3 million square feet, a 44 percent year-over-year decrease from January 2024’s 18.5 million square feet. By contrast, January 2024 had already begun on weak footing, as it posted a 57.2 percent drop from January 2023. The sustained slowdown between 2024 and 2025 suggests that the industrial sector’s development pipeline has been shrinking for some time, likely due to rising interest rates, cautious developer sentiment and a cooling demand for new space.
Early 2025 adjustments vs. 2024’s performance
Looking back at 2024, industrial construction activity fluctuated, but remained significantly stronger than in early 2025. The year began with a brief rebound in February, before experiencing inconsistent performance. By midyear, June posted a peak of 26.1 million square feet of industrial construction starts, though still 28.9 percent below June 2023. The second half of 2024 marked a clear downtrend, culminating in a steep drop in November (14.3 million square feet, down 42.9 percent year-over-year) and December (11.5 million square feet, down 35.3 percent).
The decline in industrial construction starts in early 2025 reflects a market adjustment, with developers taking a more measured approach amid ongoing economic hurdles. While activity remains lower than in early 2024, the shift suggests a more strategic pace of development as the industry adapts to current market dynamics.
—Posted on March 25, 2025


You must be logged in to post a comment.