

Office (Occupancy)
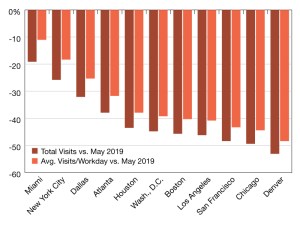
2026 Placer.ai Office Index
The latest data on national and local office foot traffic trends.
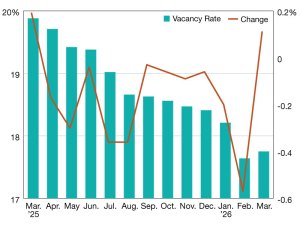
2026 Vacancy Update
The latest data shows a significant year-over-year improvement, according to Yardi Matrix.
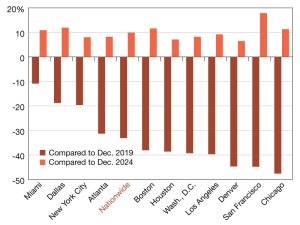
2025 Placer.ai Office Index
See the evolution of office foot traffic patterns on a nationwide and regional level.
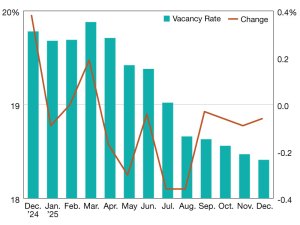
2025 Office Vacancy Update
National office vacancy fell 1.4 percent year-over-year, according to Yardi Matrix.

2024 Office Vacancy Update
How major markets are faring amid challenges, according to CommercialEdge.

Vacancies Continue to Rise Amid Banking Turmoil – Q1 Office Analysis
Future of office debates have reverberated in recent weeks as the stability of the banking system and their commercial real estate investments have come into question.
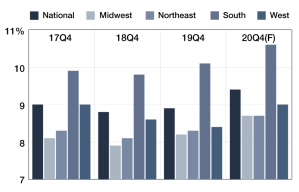
2019 National Office Occupancy
Year-over-year office vacancy rate percentages compared nationally and by region, updated quarterly.
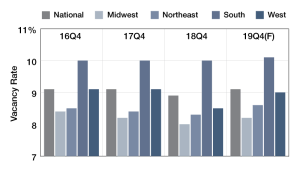
2018 National Office Occupancy
Year-over-year office vacancy rate percentages compared nationally and by region, updated quarterly.

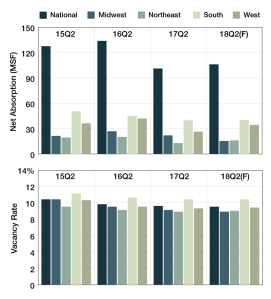
National Vacancies
Net absorptions for office markets decreased in all regions in the third quarter of 2017, compared to the same period in 2016. The Northeast registered the most significant drop—down by 73.7 percent—, and the West followed with a 45.3 percent decrease.
National Vacancies
Net absorptions for office markets decreased during the second quarter of 2017, compared to the same quarter of 2016, in all regions.