

National Vacancies
Net absorptions for office markets decreased in all regions in the third quarter of 2017, compared to the same period in 2016. The Northeast registered the most significant drop—down by 73.7 percent—, and the West followed with a 45.3 percent decrease.
U.S. office market conditions from Q3 2015 to Q3 2018*
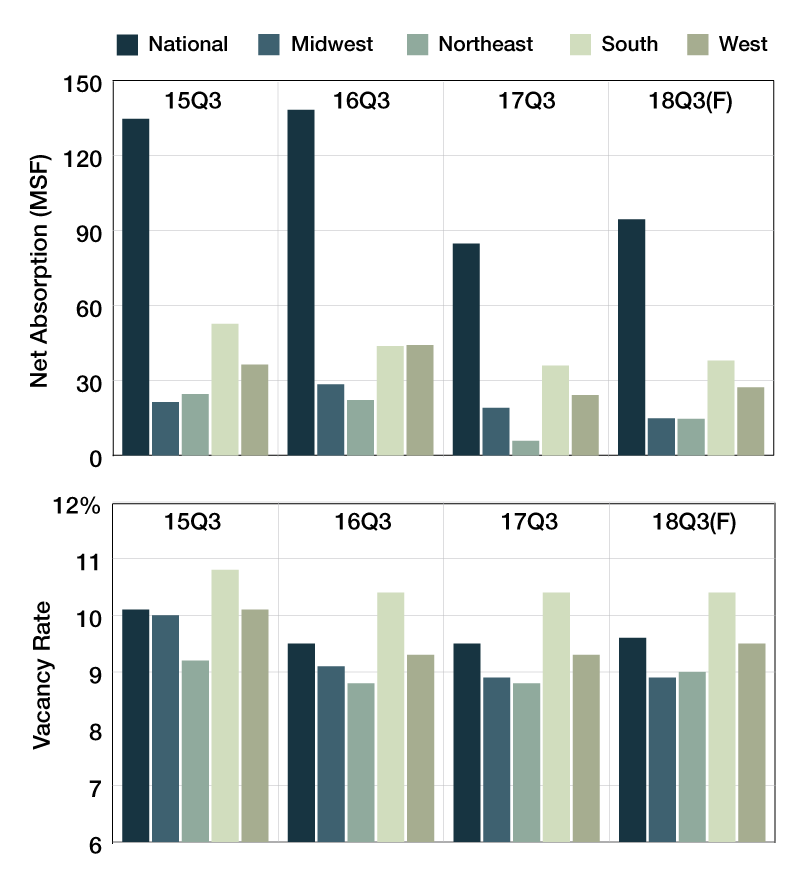
*Monthly chart cycles among office, industrial and retail. Source: CoStar Group Inc.
Net absorptions for office markets decreased in all regions in the third quarter of 2017, compared to the same period in 2016. The Northeast registered the most significant drop—down by 73.7 percent—, and the West followed with a 45.3 percent decrease. Office net absorptions on a national level decreased by 38.7 percent. Year-over-year, vacancy rates for office markets remained relatively flat in almost every region. The only change was recorded in the Midwest, where vacancies reached 8.9 percent in the third quarter of 2017, a 0.2 percent decrease since the same quarter of 2016.
Forecasts for the third quarter of 2018 call for increased net absorptions, the only exception being the Midwest, where values are projected to drop by 22.1 percent. The Northeast is projected to have the highest level of office net absorption, gaining 150.8 percent. Office vacancy rates are expected to increase slightly on a National level by 0.1 percent, while values in the Midwest, South and West are projected to remain unchanged. The Northeast is expected to post a small increase of 0.2 percent.


You must be logged in to post a comment.