


Boston’s Office Pipeline Stays on Top, Demand Slows
See how other market metrics stack up, according to Yardi Matrix.
Boston’s office market still had the country’s most active development pipeline as of May, even as demand remained uneven across traditional office and life science space, according to Yardi Matrix. Construction activity set the metro apart from other gateway markets, while leasing, investment and rent trends reflected a sector still adjusting to slower absorption, tighter capital flows and shifting tenant needs.
The metro’s life science sector is experiencing a sharp reset after years of accelerated expansion. New construction has collided with with weaker demand for lab space and a decline in occupied space, placing Boston among the major markets with vacancies above 20 percent. That imbalance is weighing on asking rents and creating more favorable conditions for tenants, while some owners are widening their search beyond traditional life science users. However, strong biotech employment and growing AI adoption are expected to support future demand.
On the policy side, Boston is still using conversions to ease pressure on downtown vacancy. The city’s office-to-residential program gives owners more time to seek tax incentives for turning older commercial buildings into housing. In March, planning officials advanced the Hub’s largest downtown conversion to date, a 219,200-square-foot project that would create 255 units at 280-300 Washington St.
Boston’s pipeline remains the largest in the U.S.
Boston’s office development pipeline was the largest nationally as of May, with 3.9 million square feet underway. The figure accounted for 1.5 percent of the metro’s total inventory, almost four times the 0.4 percent national figure.
The metro surpassed Manhattan (3.1 million square feet), Dallas (2.6 million square feet) and San Diego (1.7 million square feet). In terms of share of total office stock, San Diego (1.7 percent) was the only large U.S. market to rank ahead of Boston.
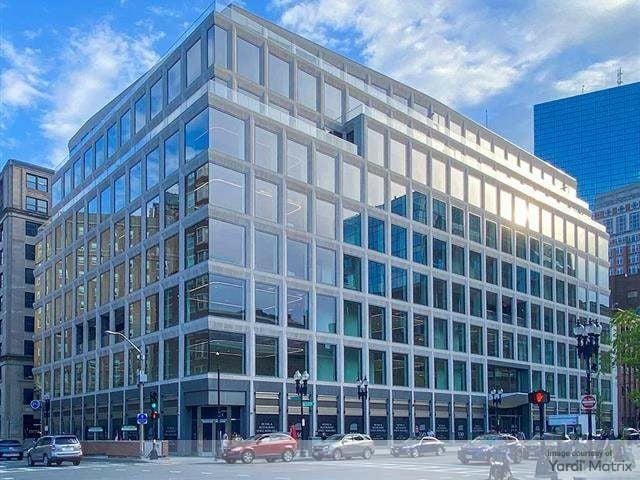
One of the largest projects underway is the revitalization of Commonwealth Pier. Originally completed in 1913 at 200 Seaport Blvd., the property previously served as the center of the American wool trade. Pembroke Real Estate is working on the project targeting LEED Gold certification. Upon delivery, the 690,000-square-foot building will comprise 629,000 square feet of office space, alongside retail.
As for office completions, only one development came online in the first five months of this year. The Druker Co. completed the 221,230-square-foot building at 350 Boylston St. using funds from a $197.5 million construction loan originated by Wells Fargo Bank. The property is LEED Platinum-certified.
Office sale prices moderate
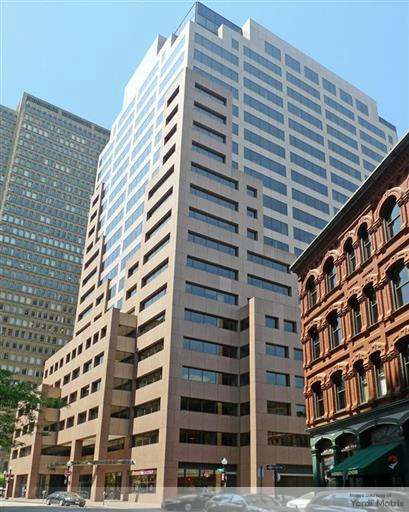
Boston’s office investment volume year-to-date as of May totaled just $483 million, lagging behind most gateway markets. Seattle ($297 million) and San Diego ($454 million) are the only peers that fared worse, while Manhattan ($3.7 billion) and San Francisco ($2.3 billion) were in the lead nationally.
Assets in the metro traded for about $201 per square foot on average, below the $213 per square foot national figure. Manhattan ($650 per square foot) commanded the highest price nationally, followed once again by San Francisco ($614 per square foot).
In May, Synergy Investments acquired the 370,000-square-foot 265 Franklin from Clarendon Group. The company paid $118 million for the LEED Gold-certified asset, a steep discount from its 2006 sale price of $170 million.
Office vacancy remains stable year-over-year
Boston office space recorded a 16.9 percent vacancy rate at the end of May, on par with the year-ago figure. The market’s index was below the 17.6 percent national average, as well as below most gateway metros.
Among peers, San Diego (23.6 percent) and San Francisco (23.3 percent) had the most vacant space, while Los Angeles (14.1 percent) and Manhattan (13.1 percent) proved more resilient.
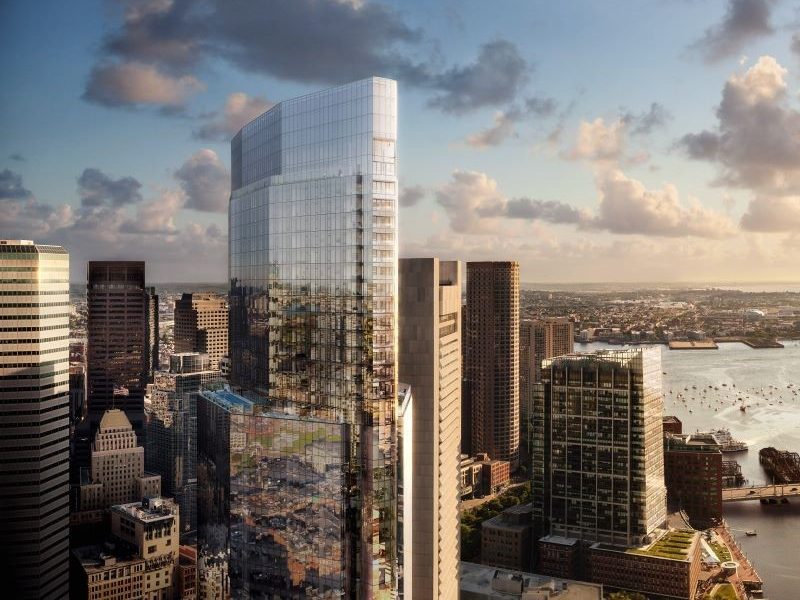
In March, JP Morgan Chase leased 250,000 square feet at Hines’ South Station Tower in the city’s central business district, one of the largest office leases in the metro since 2020. The bank is set to relocate to the 51-story, mixed-use building starting early 2028.
Another notable deal was a more than 95,000-square-foot commitment in Marlborough, Mass. Starting this fall, nonprofit human services organization Advocates will occupy the space at Boston Andes Capital’s 251 Locke Drive for almost 11 years.
Boston’s office average asking rate clocked in at $44.03 in May, marking a 4.4 percent year-over-year decline. Regardless, the figure remained above the $33.61 national average and was higher than those recorded in most gateway markets.
Flex office footprint trails national average
As of May, Boston’s coworking sector comprised more than 6 million square feet across 266 locations, representing 2.2 percent of its total office inventory, according to CoworkingCafe. That figure trailed the 2.3 percent national average. Among gateway markets, Miami (4.2 percent) posted the highest coworking share of office stock.
Manhattan led nationally for coworking footprint with 12.6 million square feet, followed by Chicago (9.2 million square feet) and Los Angeles (7.4 million square feet). San Diego (2.9 million square feet) recorded the smallest such footprint among peers.
Regus remained Boston’s largest flex office provider, operating 791,572 square feet across 41 locations. CIC followed with 472,207 square feet, while WeWork had 448,716 square feet. Industrious also maintained a notable presence in the metro, with 279,788 square feet across 10 locations.


You must be logged in to post a comment.