

2025 Office Vacancy Update
National office vacancy fell 1.4 percent year-over-year, according to Yardi Matrix.
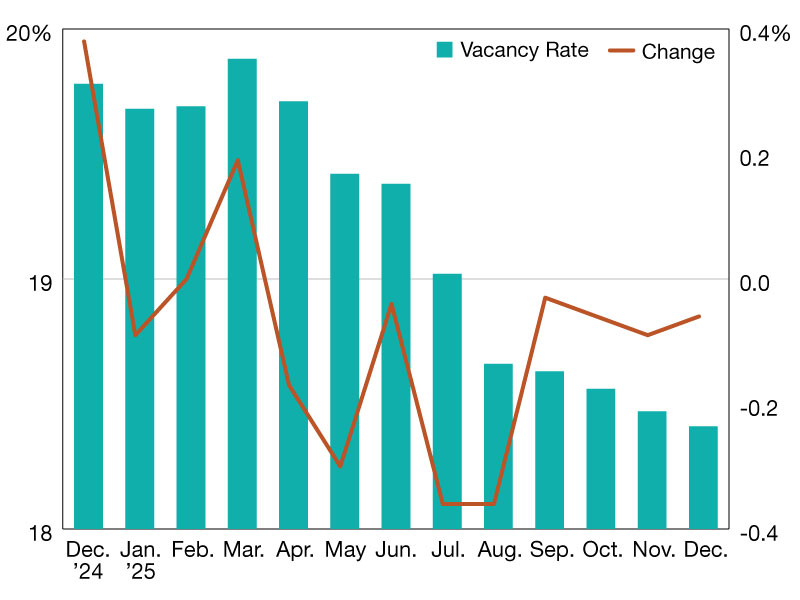
By the end of 2025, national office fundamentals showed steady improvement. The vacancy rate closed the year at 18.4 percent, down 1.4 percent from 19.8 percent in December 2024, according to Yardi Matrix. While the pace of change was gradual, the consistent month‑to‑month decline points to a sector that is slowly absorbing space and moving toward greater stability.
The year began on uneven footing. In January, vacancy measured 19.7 percent and remained close to that level through February. In March, office vacancy hit its highest mark for 2025, reaching 19.9 percent.
Gradual improvement through midyear
Conditions began to improve in the second quarter. Vacancy decreased from 19.7 percent in April to 19.4 percent in June. This 33‑basis‑point decline showed that demand was starting to gain traction and that absorption was finally outpacing move‑outs. Although the improvement was moderate, it marked the first clear shift toward firmer market conditions.
The strongest progress came in the third quarter. Vacancy dropped from 19.0 percent in July to 18.6 percent in September, with July and August each recording 36‑basis‑point declines. The quarter’s total 39‑basis‑point improvement pushed the national rate below 19 percent for the first time in years. Increased leasing and fewer large-scale reductions contributed to this step forward.
The fourth quarter extended the downward trend, though at a slower rate. Vacancy moved from 18.5 percent in October to 18.4 percent in December, a 15‑basis‑point improvement. While the gains were modest, the absence of reversals suggested a stabilizing environment. By year‑end, vacancy had reached its lowest point of 2025, offering a firmer foundation for conditions heading into 2026.
—Posted on January 26, 2025
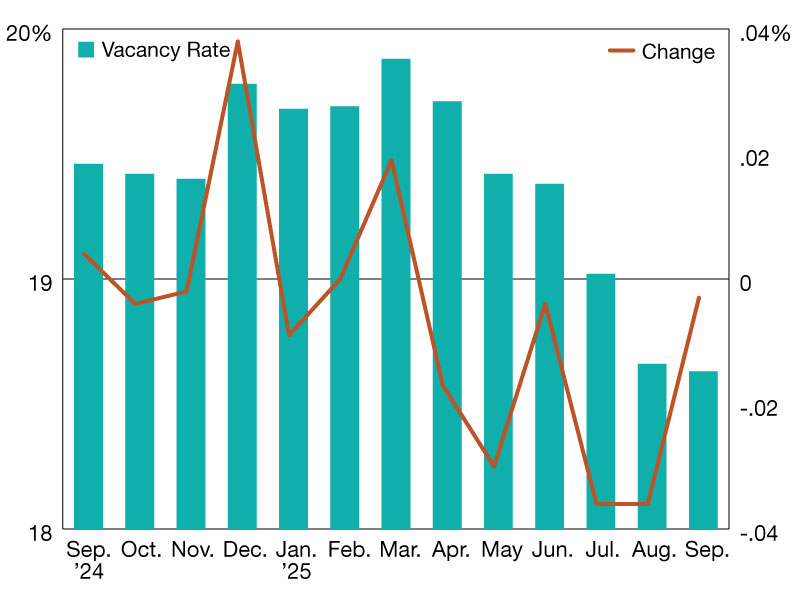
As of September 2025, the national office vacancy rate stood at 18.6 percent, reflecting a 0.8 percent year-over-year decrease, according to Yardi Matrix. Compared to 19.5 percent in September 2024, the market recorded a gradual but meaningful decline in vacant office stock. While modest at first glance, this shift represents a steady stabilization trend following several years of volatility and elevated vacancies in the office sector.
Month-to-month data highlights a clear pattern of fluctuation tied to leasing cycles and renewal activity. Vacancy levels held relatively steady through late 2024, hovering around 19.4 percent in October and November before rising sharply to 19.8 percent in December—a 0.4 percent month-over-month increase reflecting year-end expirations and tenant relocations.
Early 2025 brought a more balanced phase. January and February each posted vacancy rates of 19.7 percent, as renewed leasing momentum helped offset earlier departures. The first signs of consistent improvement emerged in spring: by May and June, vacancy edged down to 19.4 and 19.3 percent, respectively, followed by a more pronounced drop to 19.0 percent in July.
Through the summer, the decline gained traction, with rates sliding to 18.7 percent in August and 18.6 percent by September—the lowest level in the observed period. Despite intermittent month-to-month swings, the broader trajectory points to a measured but durable recovery.
Vacancy changes in major metros
Some of the most significant year-over-year drops in office vacancy occurred in Houston, where rates fell 5 percent to 20.1 percent in September, followed by Manhattan, which saw a 4 percent decline to 12.7 percent—the lowest on our list. At the other end of the spectrum, Washington, D.C., experienced a 2.3 percent decrease, bringing vacancy to 20.2 percent in the metro. Nashville’s vacancy fell 2.2 percent year-over-year, settling at 19.5 percent. Meanwhile, office vacancy was highest in Seattle and Austin, both reaching 27 percent.
Incremental absorption and selective tenant expansions helped bring the national vacancy rate down nearly a full percentage point over 12 months, underscoring renewed stability in a still-evolving office landscape.
—Posted October 29, 2025
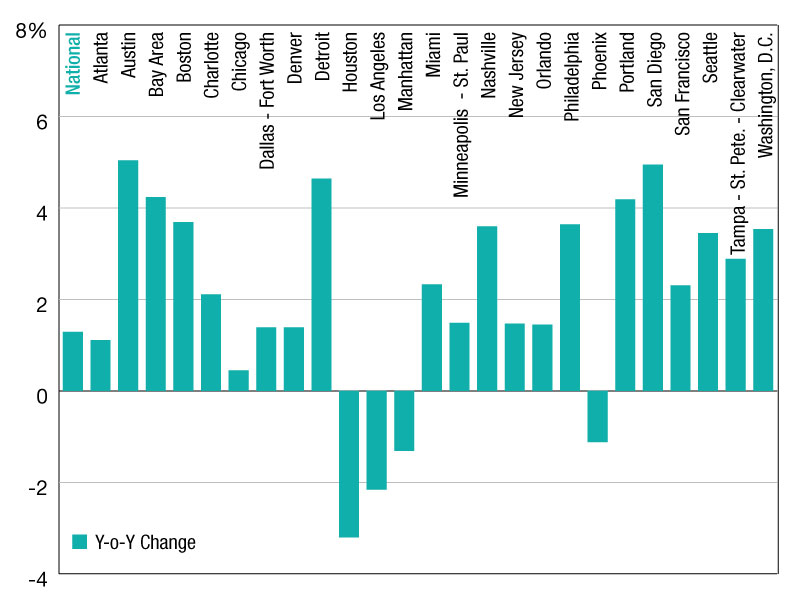
As of June, the national office vacancy rate continued to rise, posting a 1.3 percent year-over-year increase, according to Yardi Research Data. Although the pace of growth has moderated in some areas, vacancy expansions remained the norm across most tracked U.S. markets.
Austin once again topped the list with the sharpest increase—up 5.0 percent year-over-year—highlighting the ongoing challenges facing Sun Belt metros with elevated development pipelines. San Diego (4.9 percent) and the Bay Area (4.2 percent) also saw notable jumps, as demand in tech-heavy regions remains sluggish amid evolving workplace strategies.
West Coast markets continued to underperform, with Portland (4.2 percent) and San Francisco (2.3 percent) registering sizable gains. These figures reflect broader trends of lagging recovery in coastal urban hubs, where hybrid work adoption has been more persistent.
Signs of stability emerge in select markets
In contrast, some markets have started to show improvement or relative stabilization in office vacancy. Houston led the pack with a 3.3 percent decline in year-over-year vacancy, followed by Los Angeles (-2.2 percent) and Manhattan (-1.3 percent). These shifts may be attributed to limited new supply and steady tenant retention in some urban cores.
Florida’s office performance remained mixed. Tampa–St. Petersburg–Clearwater saw a significant 2.9 percent vacancy uptick, while Miami posted a milder increase of 2.3 percent.
The data underscores the continued fragmentation of the U.S. office sector, with geography, tenant demand and construction activity shaping widely divergent outcomes.
—Posted July 29, 2025
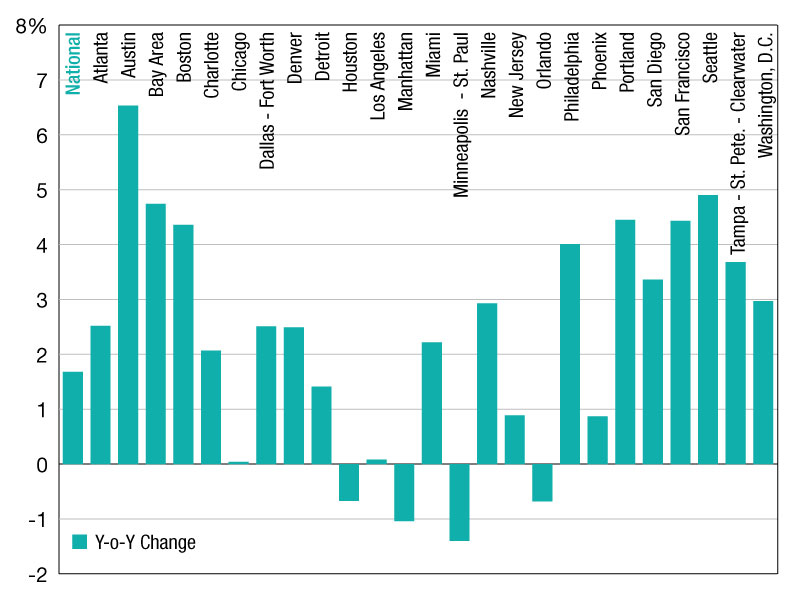
As of March, the national office vacancy rate posted a year-over-year increase of 1.7 percent, reflecting a persistent imbalance between supply and demand across U.S. markets, according to CommercialEdge data.
Although not as steep as previous periods, the upward trend remained widespread, with a majority of tracked metros seeing vacancy expansions.
Austin led the country with one of the largest year-over-year vacancy increases at 6.5 percent—continuing a pattern of oversupply that has weighed on Sun Belt cities. Seattle (4.9 percent), the Bay Area (4.7 percent) and Boston (4.3 percent) followed closely, underscoring ongoing hurdles in tech-heavy and coastal urban markets.
West Coast struggles, East Coast improves
Portland, Ore. (4.4 percent), San Francisco (4.4 percent) and San Diego (3.4 percent) also reported significant jumps, highlighting a slower recovery trajectory for West Coast cities, CommercialEdge shows.
Meanwhile, Los Angeles and Chicago stood out for their near-zero year-over-year changes in vacancy. In Los Angeles, the vacancy rate ticked up just 10 basis points, from 16.4 percent in March 2024 to 16.5 percent in March 2025. Chicago saw a similarly negligible rise.
On the other end of the spectrum, a handful of markets recorded year-over-year improvements. At -1.4 percent, Minneapolis–St. Paul saw one of the sharpest declines. Manhattan (-1.0 percent) and Orlando, Fla. (-0.7 percent) also posted vacancy contractions, reflecting limited new construction or recovering tenant demand.
The data also revealed divergence among Florida markets: Tampa–St. Petersburg–Clearwater recorded a notable increase (3.7 percent), while Miami remained relatively stable (2.2 percent).
—Posted on April 29, 2025


You must be logged in to post a comment.