

National Vacancies
Net absorptions for office markets decreased during the second quarter of 2017, compared to the same quarter of 2016, in all regions.
U.S. office market conditions from Q2 2015 to Q2 2018*
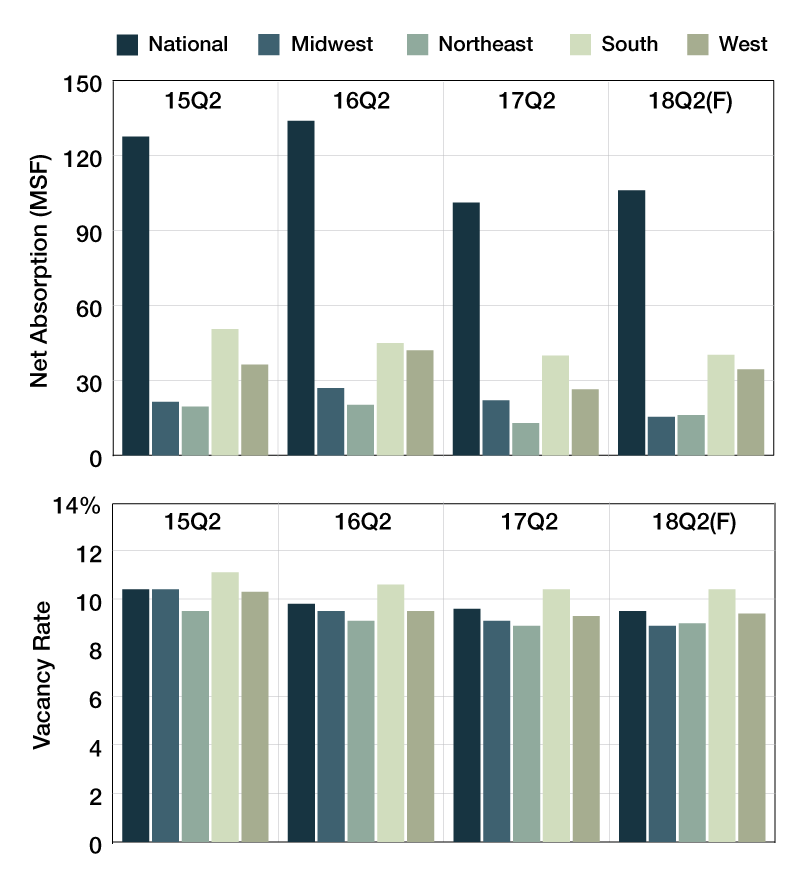
*Monthly chart cycles among office, industrial and retail. Source: CoStar Group Inc.
Net absorptions for office markets decreased during the second quarter of 2017, compared to the same quarter of 2016, in all regions. The most significant decrease was in the West, which was down by 37.2 percent, followed by the Northeast (down by 36.1 percent). On a National level, office net absorptions decreased by 24.5 percent. Year-over-year, vacancy rates for office markets decreased in all regions, with the largest change coming from the Midwest, which dropped to 9.1 percent in the second quarter of 2017 from 9.5 percent.
Forecasts show that in the second quarter of 2018 net absorption is expected to decrease only in the Midwest, by approximately 30 percent, while the remaining regions are expected to see increases. The most significant rise is expected to be in the West (up 30.2 percent). Vacancy rates for office markets are expected to decrease on a national level by 0.22 percent, with decreases in the Midwest and the South. Small increases are expected only in the West (0.2 percent) and in the Northeast (0.5 percent).


You must be logged in to post a comment.