

2025 Placer.ai Office Index
See the evolution of office foot traffic patterns on a nationwide and regional level.

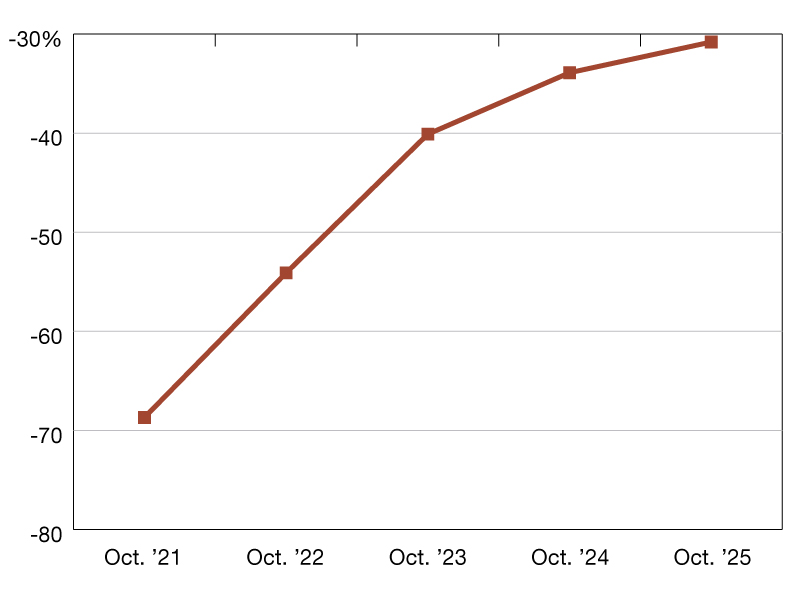
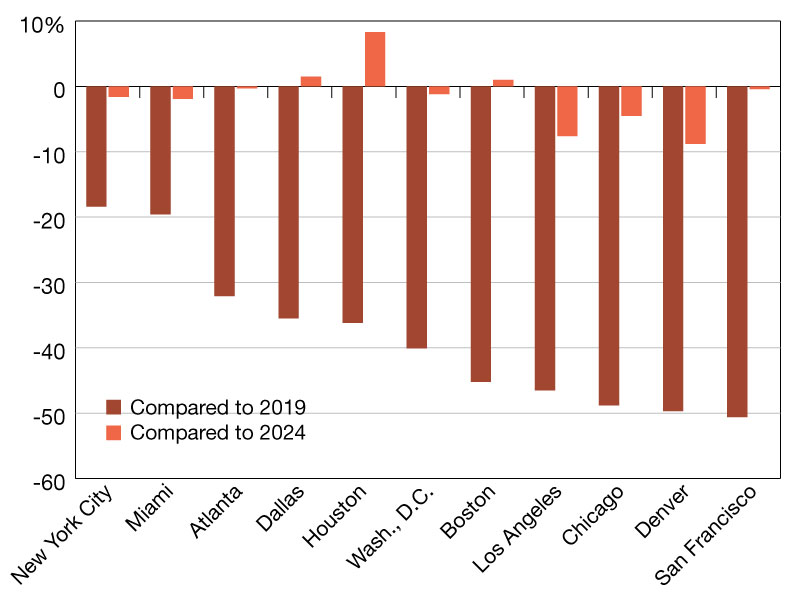
The post-pandemic office visit gap widened in December, with visits per working day 36.2 percent below 2019 levels.
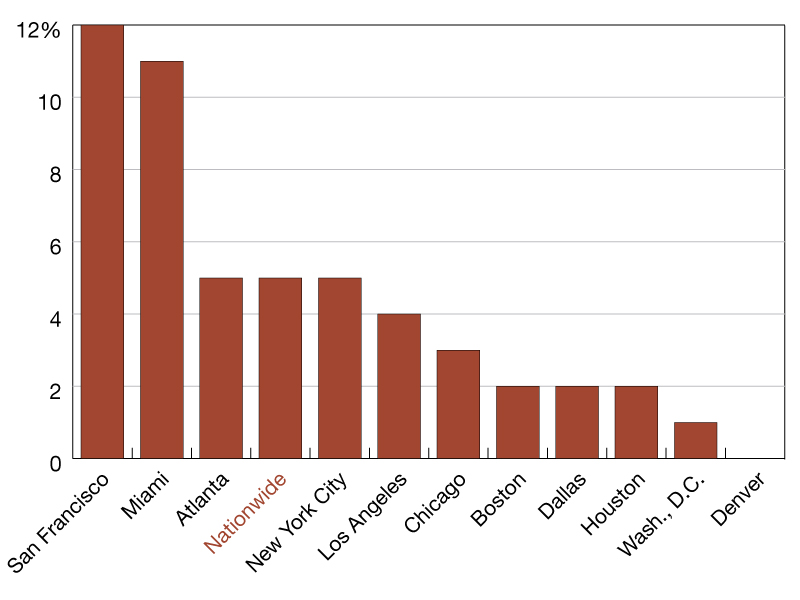
Despite the deeper December dip, it was the busiest in-office December since COVID-19, suggesting that the slowdown reflects seasonal behavior rather than waning return-to-office momentum. December’s performance varied widely by market, with Miami (-10.9 percent), Dallas (-18.8 percent) and New York City (-19.6 percent) posting the smallest gaps versus 2019, while Chicago lagged at -47.6 percent.
READ ALSO: 2025 Office Vacancy Update
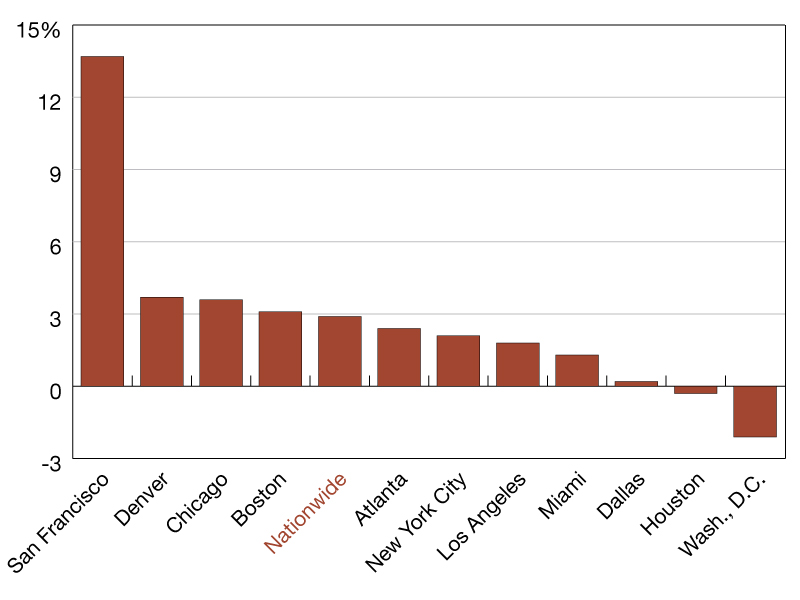
Year-over-year momentum remained positive across markets, with San Francisco posting the strongest gains.
Even as return-to-office mandates continue to accumulate, December operates on a different rhythm, shaped as much by holiday flexibility and inclement weather as by formal policy. We dove into the data to see how office attendance reflected these dynamics this year.
The quietest month
In December 2025, visits to office buildings nationwide were 33.1 percent below 2019 levels—36.2 percent below when accounting for working days—the widest year-over-six-year gap seen in recent months on a per-working-day basis.
But the softness appears to reflect shifting work patterns rather than a stalled recovery. Despite slowing from recent months, December 2025 was still the busiest in-office December since COVID-19, suggesting that the slowdown was driven by seasonal rhythms rather than any substantive pullback in office attendance.
December has long followed a different in-office rhythm than the rest of the year, and despite return-to-office mandates, many companies likely relax on-site expectations during the holidays, allowing employees to work remotely while traveling or spending time with family. Much like the TGIF workweek, which sees a consistent drop-off in office activity on Fridays despite RTO pushes, the December dip may simply reflect the solidification of a new post-COVID-19 seasonal norm.
Local factors shape the December dip
Local factors also appear to have impacted December office attendance. Miami saw a visit gap of just 10.9 percent versus 2019, followed by Dallas at 18.8 percent. As warm-weather cities that also see the highest Friday office attendance among the analyzed markets, both may be less susceptible to holiday-adjacent work-from-home behavior.
New York City, by contrast, recorded a 19.6 percent visit gap, likely weighed down by harsher winter weather and an early, severe flu season. And Chicago trailed the pack with a 47.6 percent visit gap, pointing to a sharper seasonal pullback that may have been amplified by winter conditions, elevated flu activity, and workers opting to travel to warmer destinations during the holidays.
YOY momentum still points up, especially for San Francisco
The year-over-year analysis further reinforces that December’s softness is seasonal rather than a reflection of a true RTO slowdown. Even after adjusting for the number of working days, nationwide office visits rose 4.9 percent year-over-year, and every tracked market posted gains.
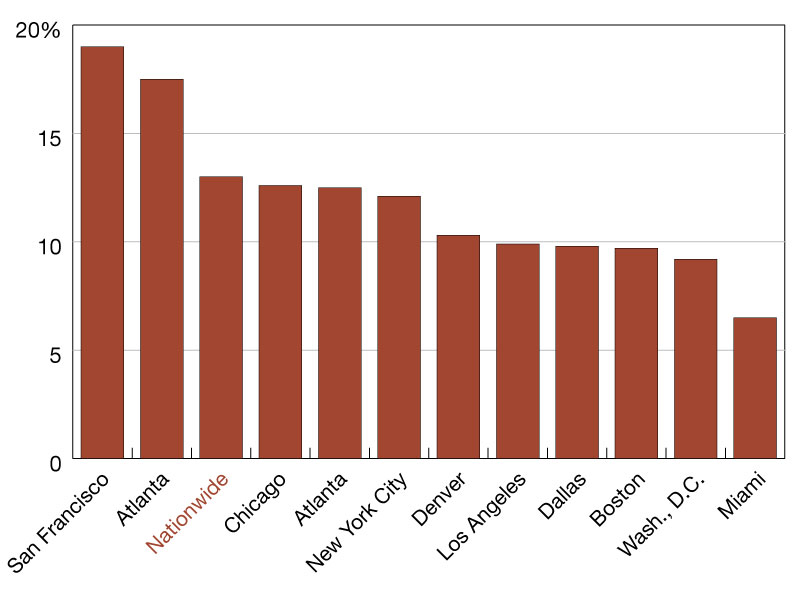
That said, growth remained uneven across major cities. San Francisco posted the strongest annual gains, even as it continued to trail most other analyzed markets in overall office recovery—reflecting an ongoing vibe shift in a city once defined by post-pandemic pessimism. And with the city’s AI-driven leasing boom showing no signs of slowing, that momentum appears likely to carry into 2026.
Elsewhere, year-over-year gains were smaller than in San Francisco but still meaningful, pointing to steady progress across markets even as recovery paths vary by city.
New year, new mandates
The data suggests that December’s softening reflects predictable holiday-season flexibility rather than weakening momentum. And with several high-profile return-to-office mandates set to take effect in early 2026—and other employers continuing to nudge attendance higher through quieter forms of “hybrid creep”—the broader office recovery appears poised to reassert itself in the new year.
For more data-driven office insights follow Placer.ai/anchor.
—Posted on Jan. 30, 2026
November 2025 marked the strongest November office attendance since 2019, with average daily visits on working days reaching a five-year high—although regional patterns diverged.
Office visits in November 2025 were 36.3 percent lower than in November 2019—marking an improvement over November 2024, but falling slightly behind November 2023.
READ ALSO: How Office Development’s Returning to the Top Tier
But monthly totals don’t always reflect true office activity, since the number of working days can vary from year to year. November 2025 began on a Saturday, giving the month five full weekends and the fewest working days of any November from 2019 to 2025. When we shift from looking at total visits to examining average visits per working day compared to November 2019–2024, a different picture emerges: office attendance on working days reached its highest level in five years.
Miami pulls ahead of New York on commutes and seasonality
As in recent months, Miami continues to lead the office recovery, pulling ahead of other major markets—including New York City. Many firms relocated to or expanded in Miami in recent years, contributing to the growth of the professional-services sector and boosting demand for office space and in-person work.
Meanwhile, New York City—which had led the nationwide office recovery in July—has been falling increasingly behind Miami. One possible factor is the city’s white collar workforce’s reliance on long, transit-heavy commutes: as temperatures drop and weather worsens, many NYC commuters reduce their in-office days, while Miami’s more car-dependent workforce is less affected by seasonal conditions.
Tech hubs now leading the rebound
Meanwhile, San Francisco is posting some of the strongest year-over-year gains in office visits nationwide. Despite suffering some of the steepest office occupancy declines during the pandemic, the city is now mounting one of the most robust recoveries—perhaps helped by the recent AI boom which has attracted new tech talent to San Francisco.
Other cities with a strong tech scene—including Denver, Chicago, and Boston, have also posted solid year-over-year gains—although these markets continue to trail the nationwide average when comparing current office visit rates to pre-pandemic.
By contrast, Houston and Washington, D.C. showed year-over-year declines. Houston’s office traffic may be impacted by the slower energy markets, while Washington, D.C., office trends were likely dampened by the government shutdown, which ended on Nov. 12. Although Placer.ai’s Washington, D.C. office index does not track government buildings, much of the private sector in the city is closely tied to federal agencies, so paused meetings and reduced client activity during the shutdown likely impacted in-office attendance across the board.
—Posted on December 30, 2025
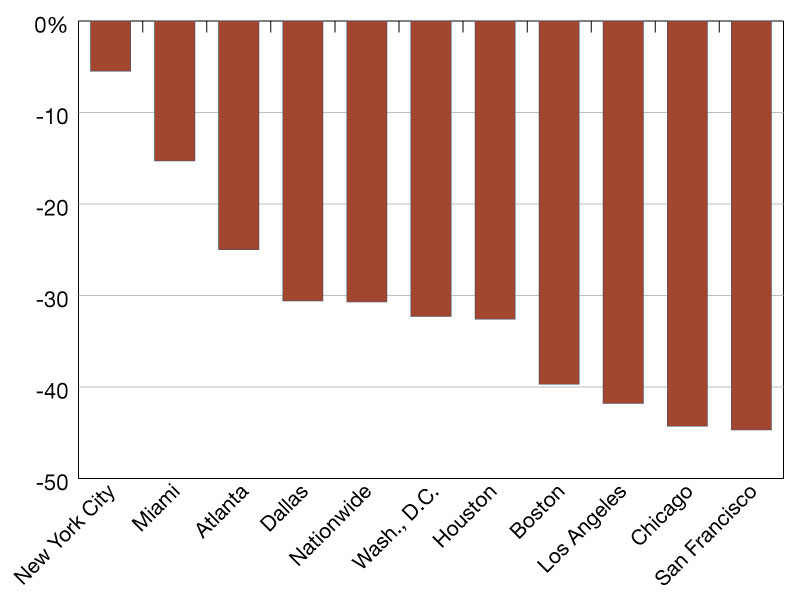
In October 2025, visits to the Placer.ai Nationwide Office Index were 30.8 percent below October 2019 levels and up 4.7 percent compared to October 2024.
Miami and New York continued to lead the post-pandemic office recovery, while San Francisco recorded the largest year-over-year rebound.
Despite the rise in five-day office mandates, visits remain heavily concentrated midweek—showing that many employees still work from home on Fridays.
READ ALSO: Office Visits Stay Strong in October
The world of work remains in flux as companies and employees keep redefining the new “normal”. On the one hand, hybrid work has become ubiquitous—and remote-driven concepts like “microshifting” are reshaping how we think about maximizing productivity. At the same time, growing awareness of co-location’s role in sustaining the social infrastructure that fuels innovation and success is prompting more companies to call employees back to the office. In 2025 alone, employers from Toyota to JP Morgan Chase, the Washington Post, Paramount/Skydance, and even the federal government joined the wave with five-day-a-week in-office mandates.
But how are these countervailing currents playing out on the ground? Is office foot traffic reaching a plateau or is the return to office still gaining momentum?
Progress still underway
In October 2025, visits to Placer.ai’s Nationwide Office Index were 30.8 percent below October 2019 levels. While this represents a larger year-over-six-year visit gap than in September, it still signals meaningful progress: September 2025 included one extra working day compared to 2019, whereas October had one fewer. And when controlling for the number of business days, October actually saw 1.2 percent more traffic than September.
Year-over-year, too, nationwide office visits grew 4.7 percent in October 2025 (see second graph below)—showing that even amid entrenched hybrid norms and ongoing pushback against in-person requirements, office visit numbers continue to trend steadily upwards.
No big regional surprises
Turning to regional RTO trends, Miami and New York continued to lead the post-pandemic recovery pack. In another sign of San Francisco’s emerging turnaround, the city once again outpaced Chicago for year-over-six-year growth and recorded the fastest year-over-year visit growth of any analyzed city. Southern hubs Dallas and Houston also outperformed the nationwide year-over-six-year benchmark of -30.8 percent, while Houston just slightly lagged at 34.9 percent.
—Posted on November 28, 2025
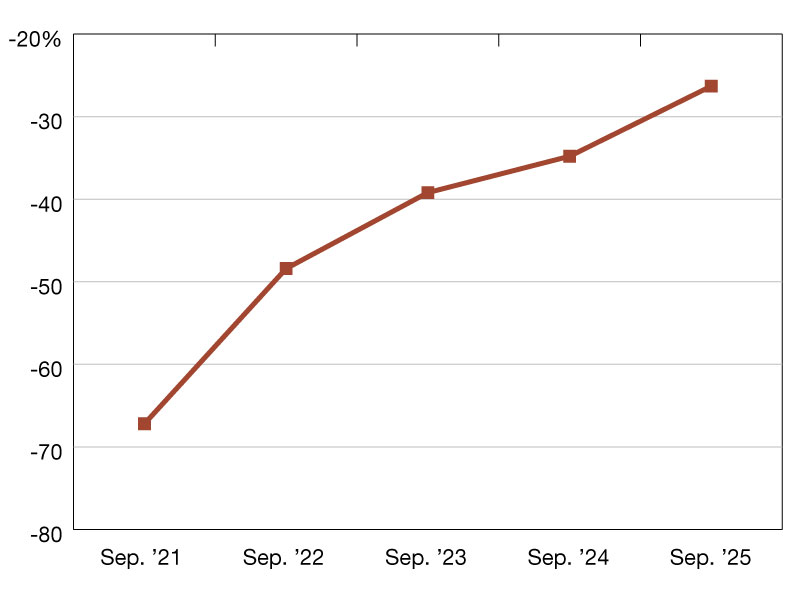
In September 2025, a wave of new RTO mandates took effect nationwide, with companies from Intel to Toyota requiring employees to spend at least four days per week in the office. And following August’s sharp retreat, September delivered a decisive rebound: office visits were just 26.3 percent below 2019 levels—a clear improvement from August and essentially tied with June’s performance.
READ ALSO: Office Visits Surge in September
This suggests that August’s dip was seasonal rather than structural—a reflection of flexible post-pandemic work habits during vacation-heavy periods. As fall routines took hold, RTO momentum strengthened once again, underscoring the nonlinear yet sustained nature of office recovery progress.
Not (just) calendar math
To be sure, some of September’s upswing can be chalked up to calendar math—the month had 21 working days, compared to 20 in both September 2024 and 2019. But that extra day alone doesn’t explain the full rebound.
Even when adjusting for working days, September 2025 ranked as the third busiest in-office month since COVID-19, just behind June and July 2025.
Miami Heat still on
Miami and New York City—two markets where in-person work has firmly reestablished itself as the norm—continued to lead the office recovery in September. In Miami, ongoing corporate migration is reinforcing an “office-first” culture, while in New York, a growing wave of finance-sector mandates is accelerating the push back to the office.
And several other markets also saw significant improvement. Dallas and Atlanta outperformed the nationwide average with office visit gaps just 15.4 percent and 22.9 percent below September 2019 levels, respectively. Meanwhile, San Francisco—though still trailing other major markets—closed its post-pandemic gap to 40.2 percent.
San Francisco gains momentum
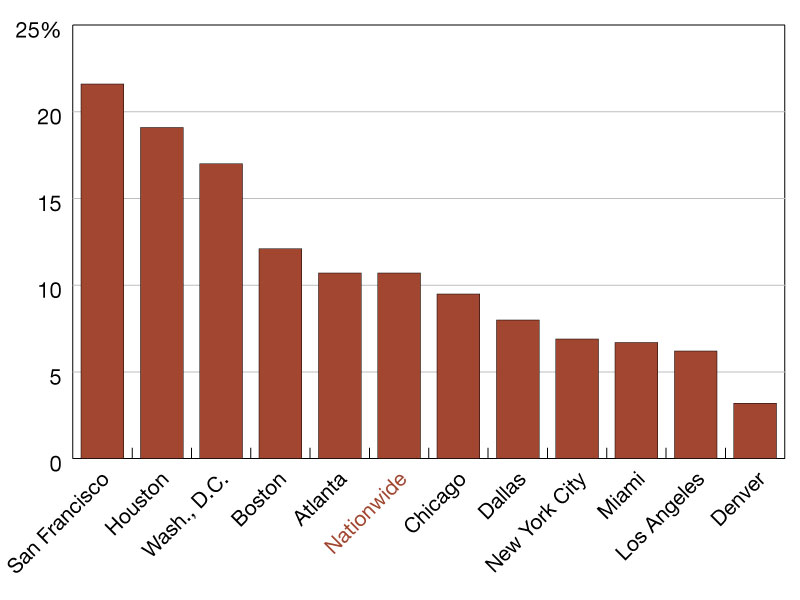
In addition, San Francisco recorded the largest year-over-year gain in office visits this September, outpacing national trends and surpassing more recovered markets.
That combination—still lagging but accelerating rapidly—mirrors what’s happening in the city’s leasing market, where AI-driven demand is fueling fresh activity and major employers are renewing their commitments to the Bay Area. Salesforce’s new multi-year investment in San Francisco further underscores confidence in the city’s long-term role as an innovation hub. And in late August, the city’s municipal workers also returned to the office four days a week, further helping set the tone for a city in the midst of a comeback.
—Posted on October 30, 2025
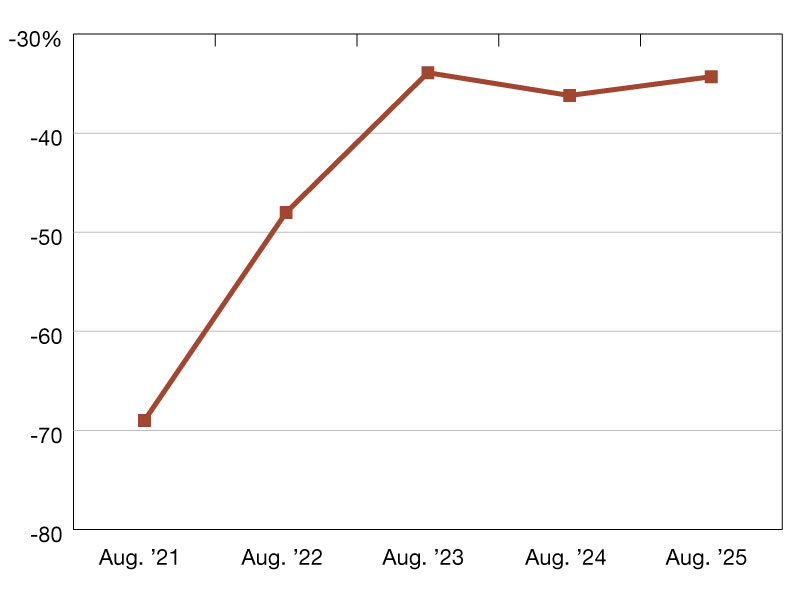
Visits to the Placer.ai Nationwide Office Building Index registered a 34.3 percent decline in August 2025 compared to the same period in 2019—a wider gap than that seen in August 2023, and an even more notable retreat from July’s encouraging 21.8 percent deficit.
However, this apparent setback is largely due to calendar differences: August 2025 had only 21 working days, compared to 22 in both August 2024 and 2019, and 23 in August 2023. When normalized for average visits per workday, August 2025 actually outperformed August 2023.
READ ALSO: Office Tenants Closer to Getting Hybrid Right
Seasonal dynamics also likely played a crucial role. August represents peak vacation season, and just as employees often embrace remote work on Fridays to extend weekends, they likely embrace similar flexibility during the peak summer travel season. Organizations may also relax in-office requirements when substantial portions of their workforce are taking time off.
So rather than signaling a genuine return-to-office reversal, August’s softer performance likely reflects the intersection of compressed work calendars and seasonal vacation patterns, with the underlying recovery trajectory remaining fundamentally intact.
San Francisco sustains momentum
The August effect impacted major markets nationwide, including New York and Miami – both of which achieved full recovery in July yet posted year-over-six-year gaps in excess of 10 percent last month. But while gaps widened across most markets, San Francisco once again avoided last place, ranking ahead of Chicago in post-pandemic office recovery metrics.
Despite still facing below-average office attendance relative to 2019 levels, the Bay Area market’s renewed momentum – bolstered by increased AI-sector leasing activity – continues drawing employees back to offices even amid summer distractions.
Chicago leads year-over-year office recovery
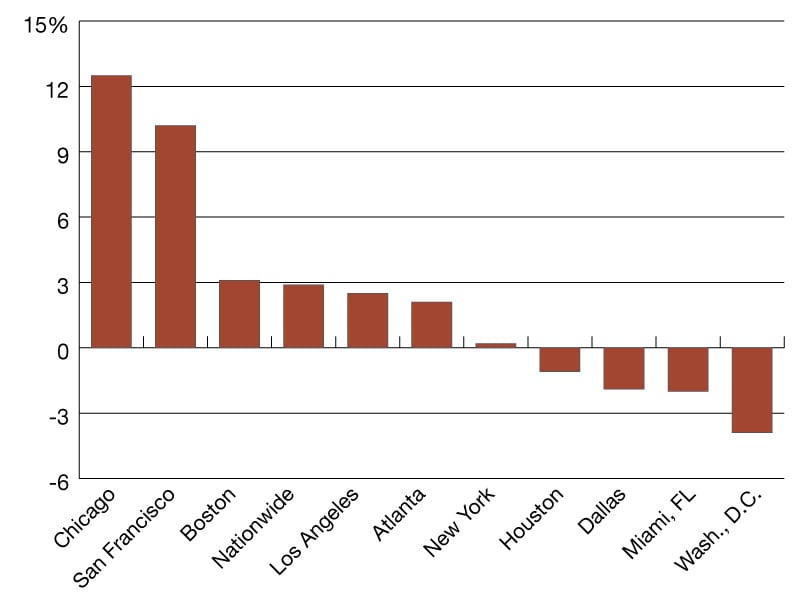
San Francisco also ranked among August’s year-over-year office visit recovery leaders, providing further evidence of the city’s robust recovery momentum. But it was Chicago that claimed the top spot with a 12.5 percent year-over-year (YoY) gain – encouraging progress for the Windy City, though it remains to be seen whether this signals the beginning of a lasting turnaround.
Meanwhile, Boston also exceeded the nationwide year-over-year average of 2.9 percent with a 3.1 percent increase, while Washington, D.C. lagged behind with a YoY decline of 3.9 percent.
—Posted on September 26, 2025
The office recovery is in full swing with major employers such as Samsung, Google and Starbucks have tightening return-to-office policies in recent months. And though hybrid work remains prevalent across industries, the second quarter of 2025 saw a majority of Fortune 100 employees subject to full-time in-office mandates—up from just 5.0 percent in the second quarter of 2023.
In June, accumulating RTO mandates helped shrink the post-pandemic office visit gap to 27.4 percent, compared to the same period in 2019. And July 2025 set a new record for office attendance, with visits down just 21.8 percent relative to July 2019 (both Julys had 22 working days)—making it the single busiest in-office month since COVID-19.
Office visit gaps close in NYC and Miami
Stark regional differences remain, however, between major business hubs nationwide. New York City, where many employees are subject to the stricter in-office requirements of the finance world, saw positive (+1.3 percent) year-over-six-year office foot traffic growth in July 2025—a first since Placer.ai began tracking these trends. Miami, which has developed a thriving financial sector of its own, followed closely behind, effectively closing its visit gap with a 0.1 percent lag.
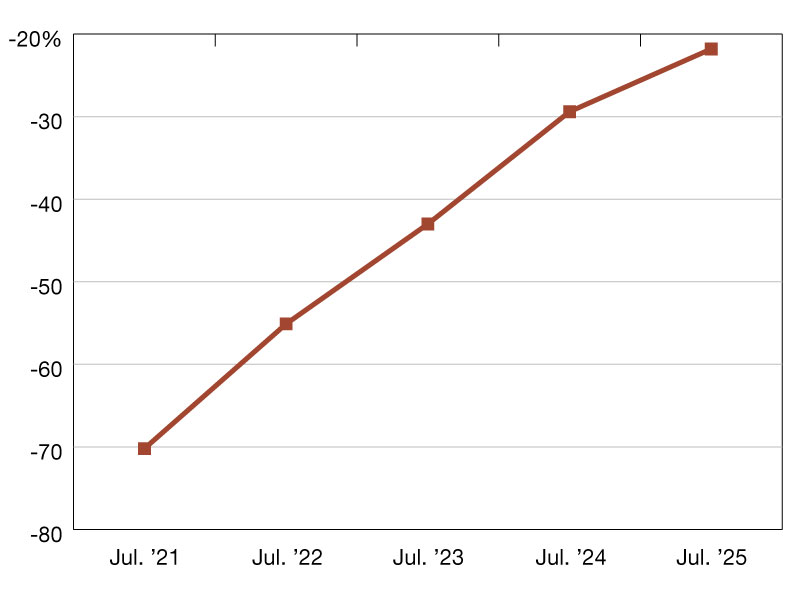
Atlanta and Dallas also made considerable headway—both markets saw visit gaps dip below 20 percent compared to 2019. Meanwhile, Denver—an emerging hub for tech startups and one of the most remote-friendly labor markets in the U.S.—took up the rear, while San Francisco inched up two notches in the rankings, beating out both Denver and Los Angeles.
Indeed, San Francisco appears to be in the midst of a major revival, with rising rents, improving public sentiment, and waves of new restaurant, retail and small business openings breathing fresh life into a city once dismissed as stuck in a “doom loop”. And in July 2025, the City by the Bay once again topped the year-over-year office recovery charts, outpacing all other analyzed hubs with remarkable 21.6 percent visit growth—more tangible evidence of the progress San Francisco continues to make.
—Posted on August 29, 2025
2025 is shaping up to be the year of the RTO mandate. Local governments and companies across industries—from AT&T to Amazon and Starbucks—have introduced stricter in-person requirements, with some even shifting back to a full five-day, in-office work week. Still, rolling out these mandates hasn’t been entirely smooth sailing, and many workplaces still strive to strike a balance between RTO and WFH.
So how are these trends unfolding on the ground? Did the office recovery continue to stagnate as it did in May, or did the start of the summer reignite RTO momentum? We dove into the data to find out.
Mandate-driven momentum
After losing a bit of steam in May, office visits regained their stride in June. Foot traffic to the Placer.ai Nationwide Office Index was just 27.4 percent below pre-COVID-19 levels—a significant improvement from June 2024, when it was down by 32.9 percent. While part of this uptick can be attributed to June 2024 having one fewer working day (19, compared to 20 in both 2019 and 2025), the data nevertheless points to meaningful RTO progress.
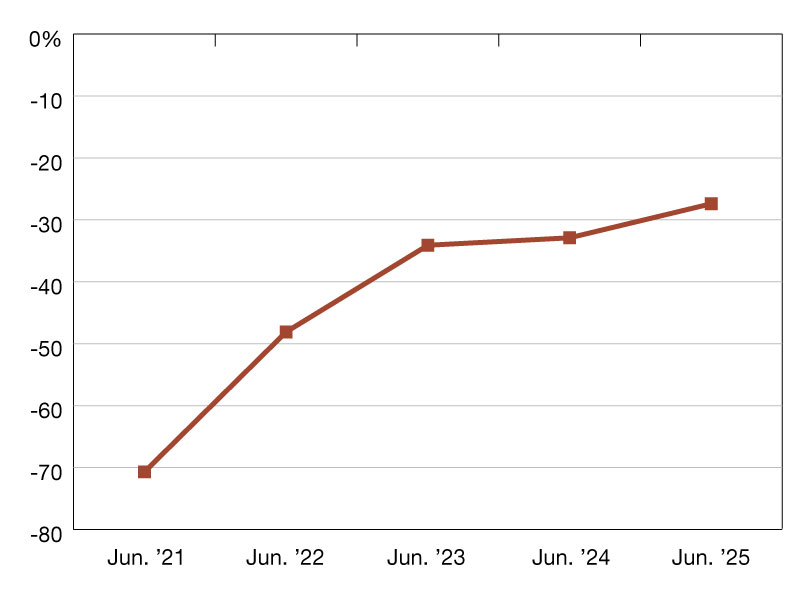
And looking at monthly fluctuations in office visits since June 2019 further highlights the month’s strong performance. Despite having only 20 working days, June 2025 ranked as the fourth busiest in-office month since the pandemic, trailing only October 2024, July 2024 and April 2025—each with 22 working days.
Miami and New York set the pace
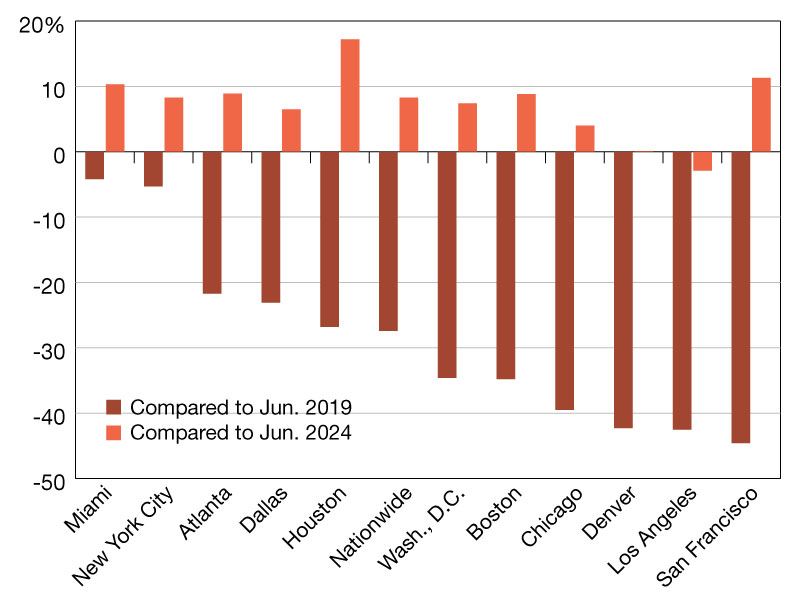
Once again, Miami and New York led the RTO charge, with both cities nearing a full post-pandemic recovery. Miami posted just a 4.2 percent gap compared to June 2019, while New York recorded a 5.3 percent deficit—putting them both well ahead of the nationwide average. Sunbelt cities such as Atlanta, Dallas and Houston also outperformed the U.S. overall, reflecting a robust return to workplaces in these regions.
Most of the cities analyzed also saw notable year-over-year gains in June 2025—partly attributable to this June’s extra work day. Los Angeles was the only hub to experience a year-over-year gap—potentially linked to last month’s local protests, which may have disrupted commuting routines for some employees. Houston, for its part, lapping a storm-ridden June 2024, recorded an impressive 17.2 percent year-over-year bump. And though San Francisco remained farthest from its pre-pandemic attendance levels, the city maintained its strong year-over-year streak, suggesting steady recovery in its tech-heavy landscape.
—Posted on July 30, 2025
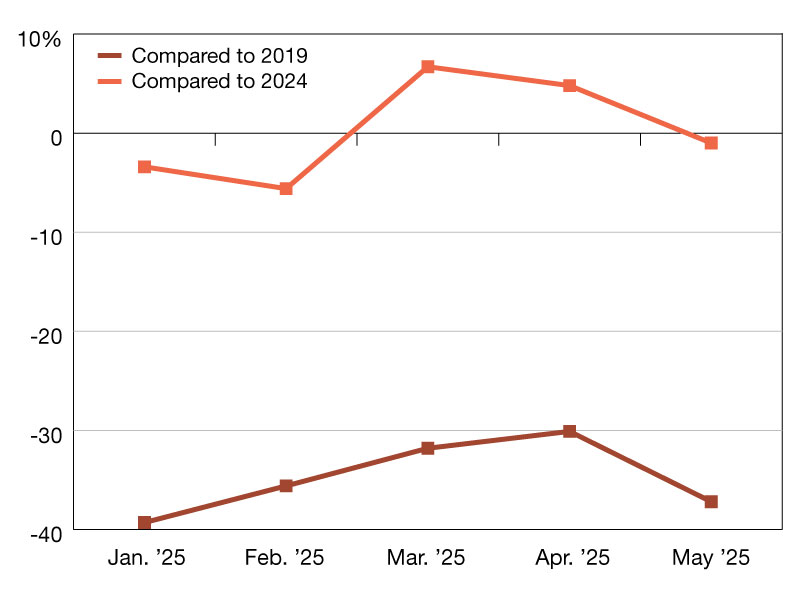
Following a strong April when nationwide office visits rose 4.8 percent year-over-year, visits fell slightly in May 2025 as traffic fell 1 percent compared to May 2024. On a year-over-six-year basis (or compared to 2019), visits were down 37.2 percent—a steep drop from April’s 30.1 percent year-over-six-year visit gap.
The weaker May numbers may be partially driven by a calendar shift, as May 2025 had an extra Saturday, and therefore one less workday, than either May 2024 or May 2019. Americans may have also chosen to take more PTO around Memorial Day this year—according to the TSA, airports were busier on the Friday before Memorial Day 2025 than they were on Friday, May 24th 2024.
But the muted May office data also highlights the persistent popularity of hybrid and remote work. According to Gallup, over half of U.S. employees work hybrid while over a quarter are fully remote—and the recent May data suggests that these work arrangements are proving difficult to change.
New York, Miami and Southern hubs lead May 2025 office recovery
Diving into the market-level data reveals that New York City and Miami continue to lead the pack, with office visits down 18.4 percent and 19.6 percent, respectively, compared to 2019. But both cities also saw slight declines compared to May 2024’s office numbers—highlighting once again the persistence of the new work arrangements and the overall slowing of the office recovery.
Southern hubs—specifically Atlanta, Dallas and Houston followed New York and Miami, with visits down 32.1 percent, 35.5 percent, and 36.2 percent compared to May 2019. Dallas and Houston also saw their office visits increase compared to 2024, with Houston specifically seeing an 8.3 percent increase in year-over-year office visits, perhaps aided by corporate relocations to the two cities. Georgia and Texas also saw their populations increase in recent years, which may be contributing to these cities’ office performance.
Meanwhile, the year-over-six-year office visit gap in Washington, D.C., Boston, Los Angeles, Chicago, Denver and San Francisco ranged from 40.1 percent to 50.6 percent, with all the cities except for Boston also experiencing year-over-year declines.
—Posted on June 26, 2025
With Google and Uber joining the ever-growing ranks of companies tightening remote work policies, employees across industries are being forced to spend more time in the office. But how much are office visit patterns really changing on the ground? Did the resurgence observed in March 2025 continue into April, or was it merely a brief reprieve from the slump seen earlier this year?
Third-busiest in-office month since COVID-19
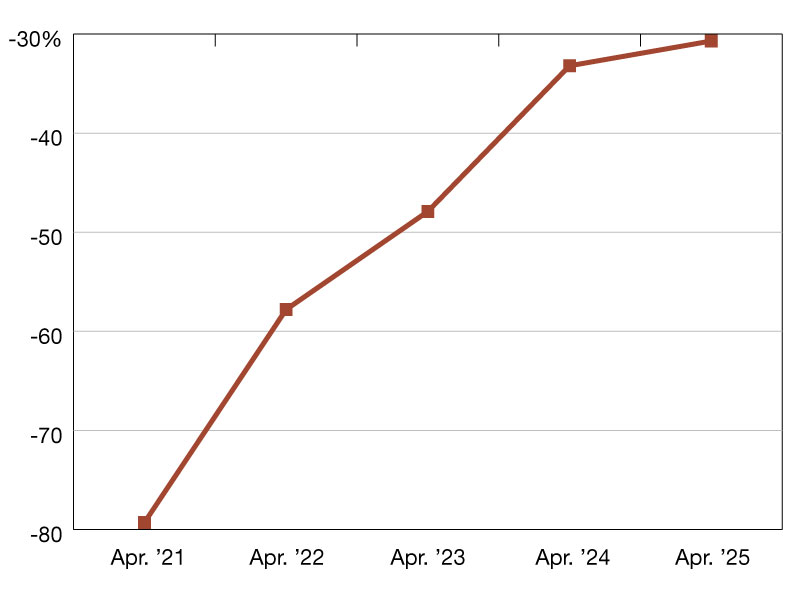
April 2025 emerged as the third-busiest in-office month since the pandemic, outpaced only by October and July 2024. Visits to the Placer.ai Nationwide Office Index were down just 30.7 percent compared to April 2019 (pre-COVID-19)—an improvement over April 2024. The upswing is especially notable given that Easter fell in April this year, whereas last year it fell in March. Though the holiday itself takes place on Sunday, many employees celebrate the occasion with a long weekend.
April 2025’s strong performance suggests that despite setbacks in January and February, the office recovery is back on track, with further increases potentially ahead in the coming months.
New York’s near-complete recovery
A closer look at regional trends shows significant variation across major business hubs. New York City, long at the forefront of office recovery, nearly closed its post-pandemic office visit gap in April 2025, with visits just 5.5 percent below April 2019 levels. Miami also performed strongly, with visits down only 15.3 percent. Meanwhile, Atlanta and Dallas outperformed the national baseline (Dallas, just barely), while San Francisco once again took up the rear with Chicago.
Tuesdays and Wednesdays are back! (in NYC)
Drilling down deeper into the data for office recovery leaders, New York and Miami highlights the continued influence of hybrid work on office visitation trends, even as numbers approach pre-pandemic levels.
Nationwide, office visits recovered most strongly mid-week. But this trend was especially pronounced in nearly-recovered NYC, where Tuesdays and Wednesdays were actually busier last month than they were during the same period of 2019 – and where Thursdays were essentially on par with April 2019 levels. Meanwhile, Fridays, and to a lesser extent Mondays, remained significantly below pre-COVID benchmarks. In Miami, too, it was midweek attendance that powered the office recovery – though Fridays rebounded more strongly in the Florida hub than in New York or nationwide.
San Francisco leads in YoY growth
Turning to year-over-year trends, San Francisco once again led in annual office visit growth—suggesting that accumulating RTO mandates in the city’s tech sector may be fueling substantial recovery. Boston was not far behind, with visits up 7.4 percent year-over-year. And while most other cities also posted year-over-year visit growth, a few hubs, including Houston and Los Angeles, saw modest declines.
This blog includes data from Placer.ai Data Version 2.1, which introduces a new dynamic model that stabilizes daily fluctuations in the panel, improving accuracy and alignment with external ground truth sources.
—Posted on May 29, 2025
Return-to-office mandates seem to be everywhere. Following the federal government’s example, local governments from the City of Atlanta to the State of Texas have introduced stricter in-office requirements. And an increasing number of corporations are demanding full-time in-person work—including firms like JPMorgan, which began enforcing a five-day RTO mandate in early March.
But what does ground-level data tell us about how these new policies are affecting office attendance in practice? Did the RTO slowdown observed in January and February continue into March? Or is a new resurgence underway?
RTO marches ahead
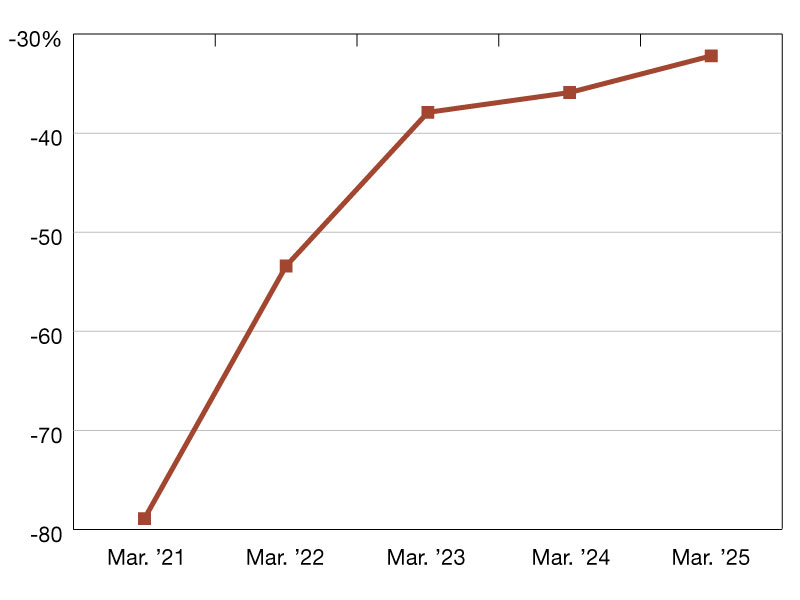
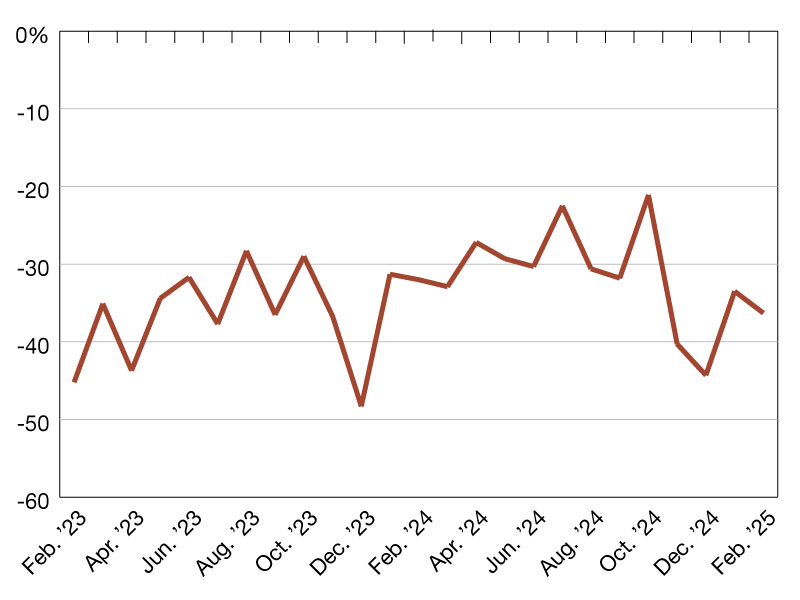
The latest data from the Placer.ai Office Index suggests that nationwide office visits may be trending upwards once again. Although March 2025 office visit levels didn’t match the peaks of October and July 2024, visits last month were only 32.2 percent below March 2019 levels—an improvement over March 2024.
Significantly, among months with 21 or fewer working days, March 2025 ranked as the second-busiest in-office month since the pandemic, just slightly behind October 2023 (October and July 2024 both had 22 days). So while January and February’s declining numbers hinted at a stalled market, March’s uptick suggests that lower office attendance earlier in the year may have been due to temporary factors like weather, and that the RTO may still be gaining momentum.
New York Still in the lead
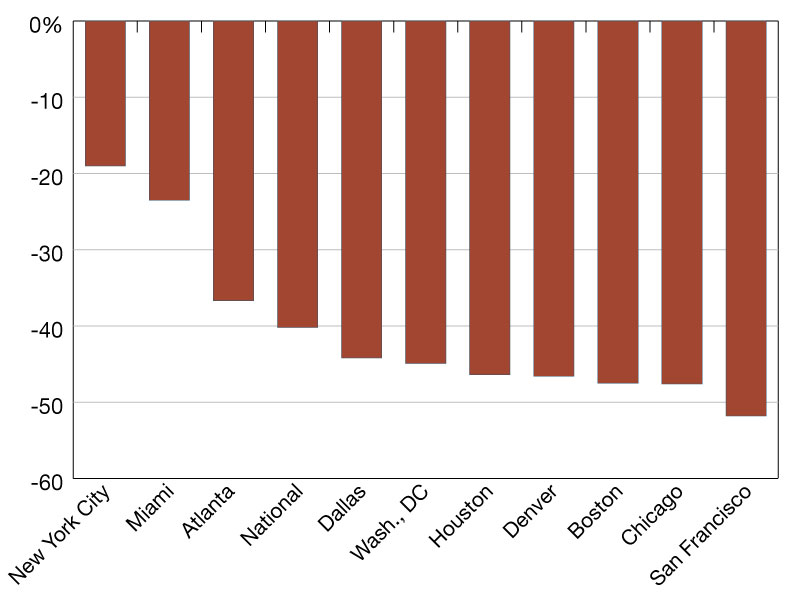
Diving into the data for eleven major business hubs nationwide shows New York City and Miami once again at the head of the office recovery pack. Visits to NYC office buildings in March 2025 were just 11.4 percent below pre-pandemic (March 2019) levels, while Miami trailed by 17.3 percent.
Meanwhile, Atlanta (-29.3 percent), Washington, D.C. (-30.6 percent), Dallas (-30.7 percent) and Houston (-31.0 percent) all outperformed the nationwide average of -32.2 percent. San Francisco tied in last place with Chicago, with visits 44.6 percent below 2019 levels.
YoY upticks (nearly) across the board
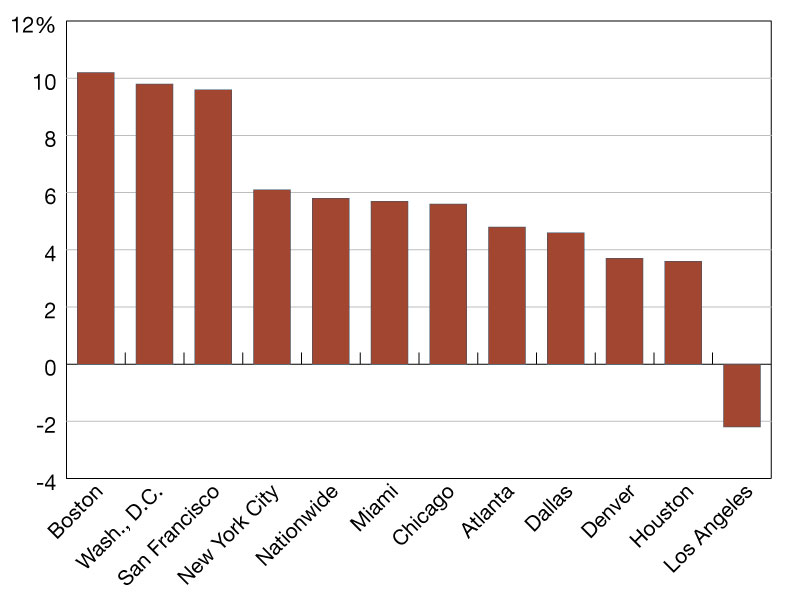
Turning to year-over-year data, ten of the eleven analyzed cities experienced year-over-year office visit growth—led by Boston, with a 10.2 percent uptick. Washington, D.C. also recorded strong annual gains (9.8 percent), while San Francisco continued its recent positive momentum with a 9.6 percent increase. Los Angeles was the only city to see a minor (-2.2 percent) year-over-year visit lag—perhaps lingering fallout from the wildfires earlier this year.
Overall, the Placer.ai Office Index points to a renewed upswing in RTO momentum, likely driven by increasingly strict mandates from governments and corporations. Though persistent post-pandemic office visit gaps point to the continued prevalence of hybrid work, March’s noticeable uptick suggests that offices may be poised to make further gains in the coming months.
—Posted on April 29, 2025
While headlines trumpeting an imminent return to traditional office life fueled by corporate mandates have become increasingly common in recent months, ground-level data reveals a more complex reality. Office building foot traffic indicates that the office recovery has slowed, with February visits down by 36.3 percent compared to pre-pandemic levels in February 2019. This data suggests that despite top-down pressure and return-to-office mandates at several major U.S. companies, hybrid and remote work models remain widespread.
New York and Miami lead the RTO recovery
Diving into the market-level data reveals that the nationwide average office occupancy metric was driven by relatively significant visit gaps across most analyzed cities, with the exception of New York City and Miami that continued to lead the return to office trends, followed by Atlanta. Houston, Washington D.C., and Dallas all experienced year-over-five-year visit gaps of 34.6 percent to 38.4 percent—close to the nationwide average—while the year-over-five-year office visit gaps for Boston, Los Angeles and Denver was 43.5 percent, 45.1 percent and 46.6 percent, respectively.
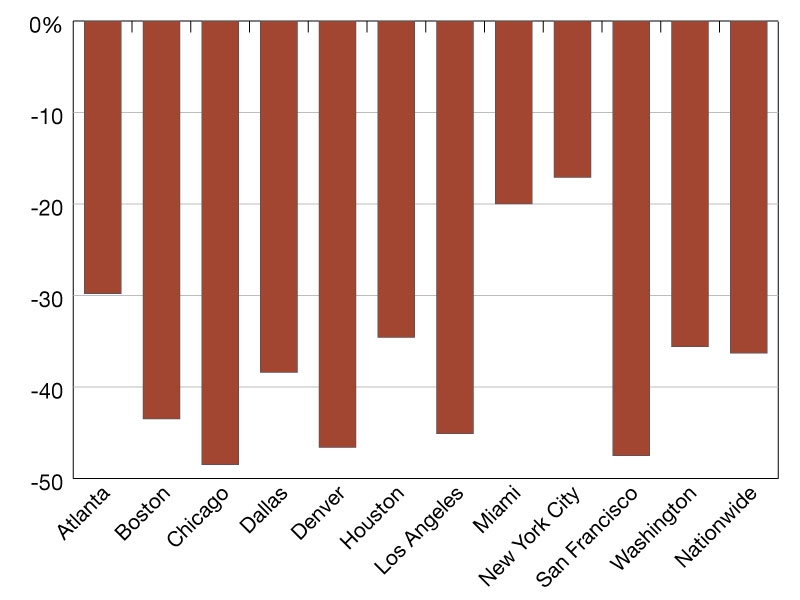
But one metric did stand out in the February data that could hint at a relatively localized return-to-office acceleration. For the first time since we started tracking the post-pandemic office recovery, San Francisco (47.5 percent year-over-five-year visit gap) outperformed Chicago (48.5 percent)—perhaps indicating that RTO mandates in the tech world are beginning to move the needle in the country’s tech capital.
Year-over-year data points to a stalling recovery
The slowing RTO trends also emerge when analyzing the year-over-year data. Although some visit gaps were to be expected given the comparison to a 29 day February in 2024, most cities—with the exception of Miami, Boston and San Francisco—saw a larger dip in office visits than the approximately 3.5 percent visit gap that could be attributed to the calendar shift.
The dip in office visits compared to 2024 suggests that the RTO mandates are not having a significant impact on office occupancy patterns in most major cities and further underscore the enduring impact of remote and hybrid work models.
—Posted on March 28, 2025
Nationwide, January 2025 office visits were 40.2 percent lower when compared to pre-pandemic January 2019. A confluence of factors, including last month’s polar vortex, as well as the mid-week New Year’s Day, likely resulted in fewer office visits than usual.
New York continued to lead the return-to-office pack, with office visits in the Big Apple just 19.0 percent lower than in January 2019. Analyzing the year-over-year data indicates that the polar vortex likely had a greater impact on employees in typically warmer climates while employees in cities that tend to have colder winters seemed less affected.
Temporary setback for RTO
Several factors seem to have converged in January 2025 to temporarily hamper the return-to-office recovery. First, last month brought a polar vortex to much of the United States, compelling Americans to stay indoors and avoid unnecessary trips outside—including to the office. January 1st also fell on a Wednesday this year, and many people likely took advantage of the calendar luck to extend their vacation through the weekend—leading to fewer January office visits compared to years when New Year’s Day falls earlier in the week.
As a result, the January 2025 bump appeared relatively muted: visits in January 2025 were only 17.7 percent higher than in December 2024, compared to a 31.3 percent month-over-month increase from December 2023 to January 2024. And visits were 40.2 percent lower than they were in pre-pandemic January 2019—a slightly worse showing than the 39.2 percent pre-pandemic visit gap of December 2024.
New York continues to lead the RTO pack
The meteorological and calendar challenges seem to have impacted office visits on a metro area as well, with few cities analyzed making significant RTO strides in January 2025. The sole exception was New York, where January 2025 visits were only 19.0 percent lower than they were in January 2019—a slightly smaller visit gap than the previous month.
Many of the cities where residents are used to and equipped for the colder weather—Chicago, Boston, and New York—seemed to have experienced a relatively minimal impact from the arctic blast. The one exception was Denver, which was exceptionally frigid—with subzero temperatures—so that even those used to cold may have opted to work from home.
But in metro areas where weather tends to be relatively warm—including Atlanta, Houston, Washington, D.C., and Dallas—the impact of the polar vortex was visibly stronger. In these cities, the year-over-year visit gap ranged from 7.5 percent (Atlanta) to 12.0 percent (Dallas)—as employees without proper winter jackets or snow tires likely chose to stay cozy and avoid the chill.
January 2025’s RTO stats may not have been particularly impressive, but the relatively weak office data is likely more a reflection of last month’s unique challenges rather than a slowdown in the RTO momentum. With the weather now back to normal and no mid-week holidays in the near future, the coming months will be critical in evaluating if the RTO is in fact slowing down or whether January just marked a temporary setback within a still unfolding story.
For more data-driven insights, visit placer.ai.
This blog includes data from Placer.ai Data Version 2.1, which introduces a new dynamic model that stabilizes daily fluctuations in the panel, improving accuracy and alignment with external ground truth sources.
—Posted on February 26, 2025


You must be logged in to post a comment.