


S&P Global Market Intelligence
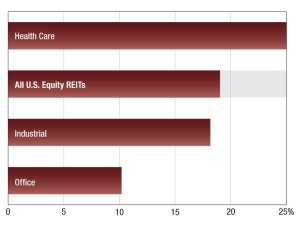
2024 Commercial REIT Values
S&P Global Intelligence’s latest snapshot of REIT performance. Read the report.
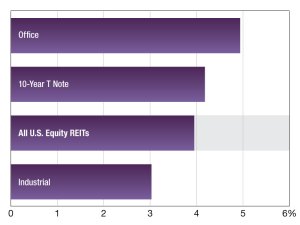
2024 Commercial REIT Dividend Yields
S&P Global’s latest snapshot compares the dividend yields of major asset categories. Read the report.
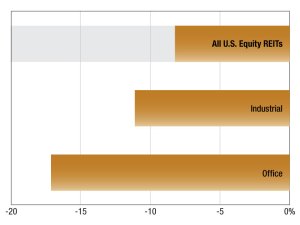
2024 REIT Trading Trends
The Dow Jones Equity All REIT Index’s latest update on performance from S&P Global Market Intelligence. Read the report.

Commercial REIT Results—October 2024
Industrial REIT payout ratios exceeded those for office and all REITs, according to S&P Global. Read the report.

2022 Commercial REIT Results
Publicly traded equity REITs had an average Q3 AFFO payout ratio estimate of 72 percent, according to S&P Global Market Intelligence.
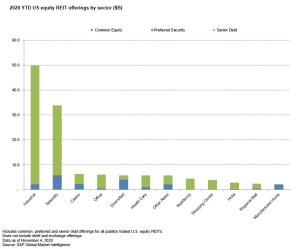
2020 REIT Offerings by Sector
Industrial and specialty REITs dominated the offerings, according to S&P Global Market Intelligence.
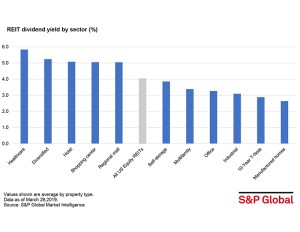
Health Care REITs Outperform
This property type posted the highest one-year average dividend yield in the sector and outperformed the broader SNL U.S. REIT Equity Index by 1.78 percentage points.
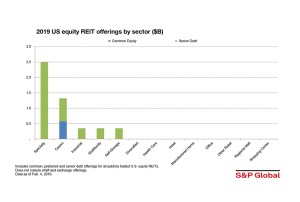
Specialty, Casino REITs Raise Most Capital YTD
These sectors topped the charts, aggregating $3.82 billion over seven senior debt and common stock offerings, according to S&P Global Market Intelligence.
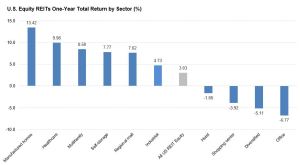
Manufactured Home Sector Beats U.S. Equity REIT Index
S&P Global Market Intelligence reports positive one-year total returns across property sectors, with the notable exception of office and retail.
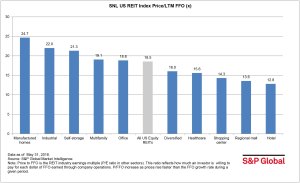
Manufactured Home REITs Outperform Market
The sector had the largest last-12-months funds from operations multiple of all publicly traded U.S. equity REITs, at 24.7x, according to S&P Global Market Intelligence data.
- « Previous
- 1
- 2
- 3
- Next »