

Newsletter Graph
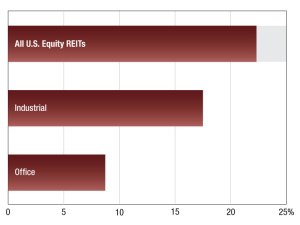
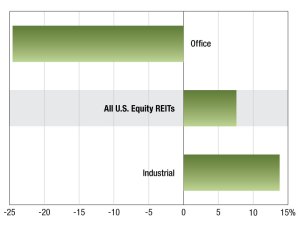
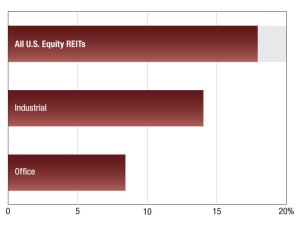
2026 Commercial REIT Values
S&P Global Intelligence’s latest snapshot of REIT performance. Read the report.
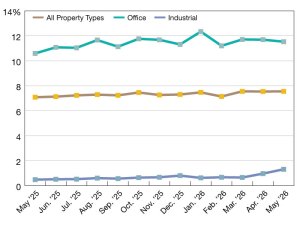
2026 CMBS Delinquency Rates
Trepp’s latest data on CMBS delinquency rates. Read the report.
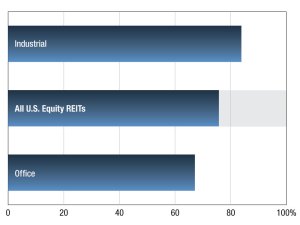
2026 REIT Dividend Yields
The latest survey from S&P Global Market Intelligence. Read the report.
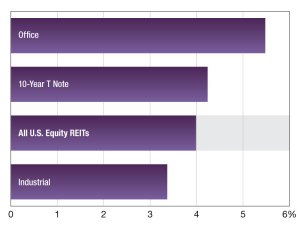
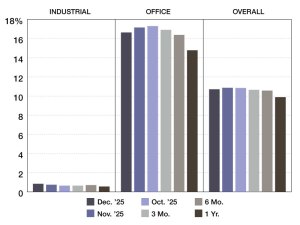
2026 REIT Returns
The Dow Jones Equity All REIT Index’s latest update on performance from S&P Global Market Intelligence.
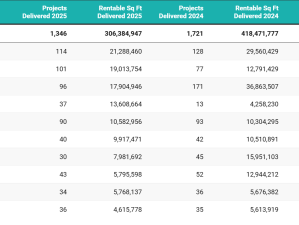
Top Markets for Industrial Development in 2025
The latest ranking points to a slowdown in activity, with some surprising outliers.
2026 REIT Trading Trends
The latest update from S&P Global Real Estate on REIT trading trends. Read the report.
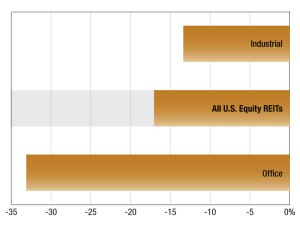
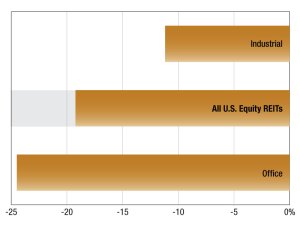
2025 Commercial REIT Values
S&P Global Intelligence’s latest snapshot of REIT performance based on FFO. Read the report.
2025 REIT Trading Trends
The latest update on performance from S&P Global Market Intelligence. Read the report.