Volume

2018 Net Lease Office Sales Volume and Cap Rates
Average cap rates continued to fall, ending the quarter at 6.5 percent—a 4 basis-point drop from mid-year, and 9 basis points down from this time last year.

2018 Net Lease Industrial Sales Volume & Cap Rates
After bottoming out at 6.1 percent at mid-year, rates have seen noticeable increases during the last two quarters, ending the year at 6.32 percent.
Cross-Border Spending Up 72% in 2018
While private investors again did most of the acquiring last year, foreign entities (mostly Canadian) accelerated their purchasing of U.S. commercial real estate.
Single-Asset Sales Set Record in 2018
Of the total $562 billion of commercial real estate trades last year, 30 percent were portfolio- and entity-level deals―the most transacted since 2007.

2018 Net Lease Retail Sales Volume & Cap Rates
Single-tenant retail sales volume versus average cap rates, updated quarterly.
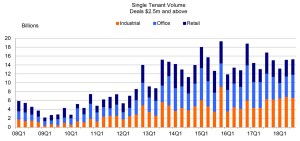
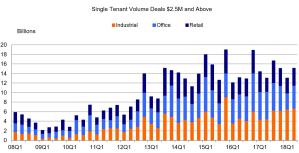
Retail Net Lease Volume Pulls Down Sector
During the third quarter of 2018, single-tenant deals were down 11 percent, reflecting a considerable drop in store-related transactions, a small reduction in office deals and an increase in industrial deals.
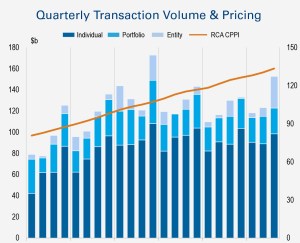
Big Deals Dominate Q3
Sizeable portfolio buys and M&A activity pushed overall transaction volume to a remarkable $29.8 billion in the third quarter, according to Real Capital Analytics.
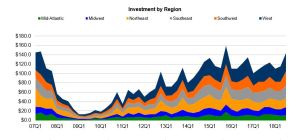
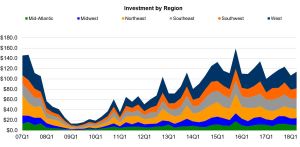
Southern Markets Drive Deal Flow in Q3
Real Capital Analytics data shows that transaction volume in the third quarter jumped almost 25 percent to $143.5 billion over the previous quarter.
Net-Lease Office Deal Volume Rises 29 Percent
In the second quarter of 2018, the sector experienced the most investment growth of the major single-tenant categories, according to Real Capital Analytics data.
Deals Pick Up the Pace in Q2
Investment volume in the second quarter of 2018 rose to $114.2 billion, a 9.1 percent improvement over the previous quarter, according to Real Capital Analytics data.