


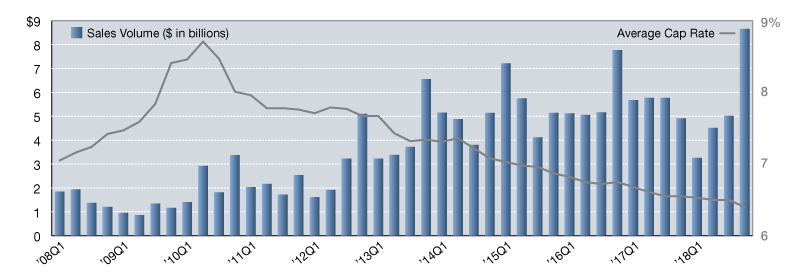
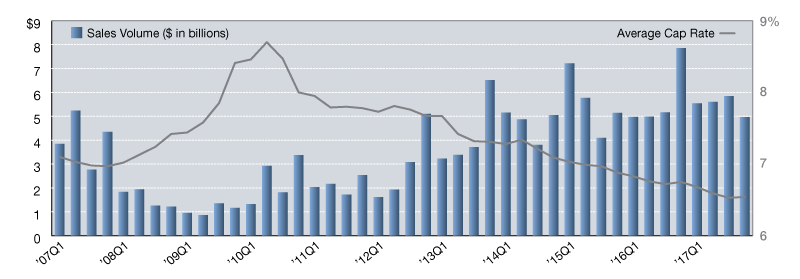
2018 Net Lease Office Sales Volume and Cap Rates
Average cap rates continued to fall, ending the quarter at 6.5 percent—a 4 basis-point drop from mid-year, and 9 basis points down from this time last year.
Source: Stan Johnson Co. Research, Real Capital Analytics
The single-tenant office sector was able to continue its trend of reporting strong annual sales totals, reporting $22.0 billion or more in each of the last four years. Buoyed by a record-setting fourth quarter, in which more than $8.6 billion in sales were logged, the office sector rebounded from its lackluster start to the year. But is that momentum sustainable? Likely not, although investor appetites for non-retail net lease assets have certainly been growing in recent years. It is more likely that the market will see a return to average levels of sales volume in early 2019. Average cap rates in the sector have yet to officially hit bottom as rates fell nine basis points to end the year at 6.4 percent. Upward movement is likely to occur in 2019, as the market has begun to see an increase in asking cap rates which will eventually be reflected in the sold averages.
Focusing on business development, industry and client-specific research, and the analysis of local and national market trends, Lanie Beck has been the Director of Research for Stan Johnson Co. since 2013.
—Posted on Mar. 19, 2019
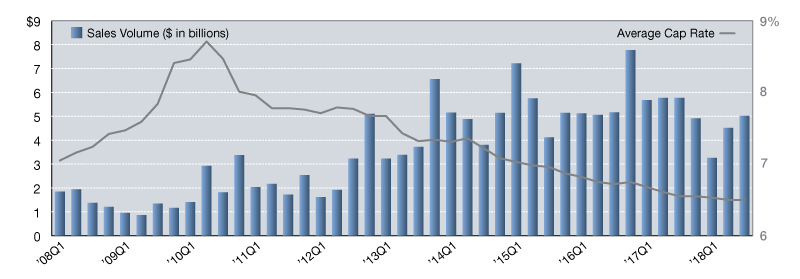
Source: Stan Johnson Co. Research, Real Capital Analytics
The single-tenant office sector continued to see cap rates compress and reported noticeable upticks in sales volume during each quarter this year. With a slow start to the year, the office sector posted more than $5.0 billion in sales during third quarter, bring the year-to-date total to $13.0 billion. While another robust quarter of activity could keep the sector on track to outpace annual volume totals reported in 2013 and 2014, it is likely the market will fall short of the $22.0-billion-plus years we’ve seen more recently. Average cap rates continued to fall, ending the quarter at 6.5 percent—a 4 basis-point drop from mid-year, and 9 basis points down from this time last year. While the rate of compression has certainly slowed, it remains to be seen if this quarter marks the bottom of the market. All but one region reported steady or falling averages, with the Midwest showing the greatest amount of downward movement—falling 24 basis points in third quarter to an average of 6.7 percent. Additional cap rate compression may be localized to specific regions, but the next several quarters will likely see overall office cap rates start to rise.
Focusing on business development, industry and client-specific research, and the analysis of local and national market trends, Lanie Beck has been the Director of Research for Stan Johnson Co. since 2013.
—Posted on Jan. 11, 2019
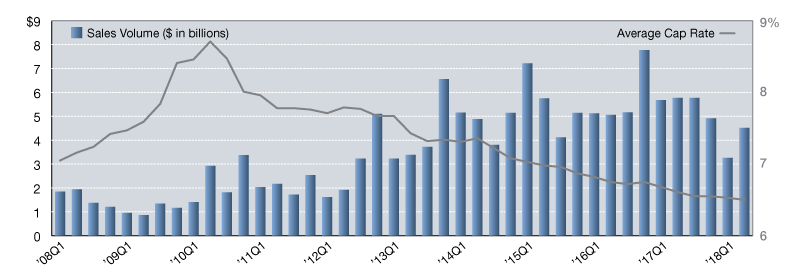
Source: Stan Johnson Co. Research, Real Capital Analytics
The single-tenant office sector began the year very slowly, reporting only $3.2 billion in sales, which was much lower than the recent average. During second quarter 2018 though, the market saw a noticeable increase in sales volume, reporting $4.5 billion. Still, the sector is lagging and likely will not be able to match sales totals seen in the last three years which have all exceeded $20 billion. Average cap rates for single-tenant office dropped a few basis points to end the quarter at 6.5 percent, marking the lowest average rates reported for the sector this century. However, with retail rates leading the upward charge, the market will likely see cap rates start to trend upward for both office and industrial product in the coming quarters. Buyer activity year-to-date has been driven primarily by private buyers as well as domestic institutional investors. Neither group has a majority market share though, which is typical for this sector. Since 2017, the market has seen a noticeable pull-back from international investors, and it remains to be seen if that trend will continue into the second half of the year.
Focusing on business development, industry and client-specific research, and the analysis of local and national market trends, Lanie Beck has been the Director of Research for Stan Johnson Co. since 2013.
—Posted on Oct. 11, 2018
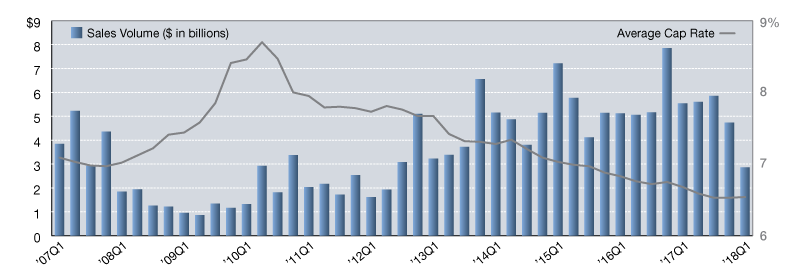
Source: Stan Johnson Co. Research, Real Capital Analytics
The single-tenant office sector had a lackluster Q1 2018, reporting only $2.8 billion in sales. This is the lowest quarterly volume reported since mid-year 2012, and it represents a nearly 50 percent decrease in sales volume from this time last year. Of all the regions, only the Mid-Atlantic saw a quarter-to-quarter increase in volume, with the Southwest and West regions reporting drastic declines. This drought is expected to be short-lived though—the pipeline of on-market office listings across the U.S. is robust and strong sale leaseback activity has positively influenced this sector in recent quarters. Average cap rates for single-tenant office product increased by a single basis point in the last three months, ending first quarter at 6.5 percent, which is the highest average across the different property classes. It remains to be seen if this is the start of a sustainable uptick in cap rates, or if we should expect to see several more quarters of a flat trendline.
Focusing on business development, industry and client-specific research, and the analysis of local and national market trends, Lanie Beck has been the Director of Research for Stan Johnson Co. since 2013.
—Posted on July 11, 2018
Source: Stan Johnson Co. Research, Real Capital Analytics
Single-tenant office sales volume outpaced the other property types in Q4 2017, reporting nearly $5 billion in sales. This brings annual totals to approximately $22 billion, which is on par with volumes reported in the two previous years. After three consecutive quarters of cap rate compression, and an even longer downward trend that began in 2009, average cap rates ticked up a single basis point at year-end 2017, closing out the year at 6.5 percent. Compared to single-tenant industrial and retail, office cap rates are currently the highest of all three sectors by six and 44 basis points respectively. We expect cap rates to bounce along the bottom for at least the next several quarters before beginning noticeable and sustained upward movement.
Focusing on business development, industry and client-specific research, and the analysis of local and national market trends, Lanie Beck has been the Director of Research for Stan Johnson Co. since 2013.
—Posted on April 18, 2018

Source: Stan Johnson Co. Research, Real Capital Analytics
Overall single-tenant sales volume surpassed $14 billion in Q3 2017, making it the strongest quarter so far this year. The office sector, however, posted lagging totals compared to the other property types. With a $0.45 billion decline from the previous quarter, the single-tenant office sector reported its lowest quarter of volume in a year with just over $5 billion in sales. Average cap rates for single-tenant office product witnessed a very small decline, falling just four basis points since mid-year. At 6.5 percent, office cap rates currently sit between retail (6.1%) and industrial (6.7%). This continued compression across the industry, albeit it fairly insignificant, continues to illustrate the “U-shaped” cap rate trendline that we’ve been experiencing for the last 18+ months. Looking forward, we expect cap rates to bounce along the bottom for another several quarters before beginning noticeable and sustained upward movement.
Focusing on business development, industry and client-specific research, and the analysis of local and national market trends, Lanie Beck has been the Director of Research for Stan Johnson Co. since 2013.
—Posted on Jan. 30, 2018


You must be logged in to post a comment.