


Which Trade Disruptions Are Really Reshaping Industrial Demand?
Tariffs and supply-chain reorganization are driving longer-term logistics strategies, while maritime and Middle East disruptions have narrower effects.
This article first appeared in the CPE Sneak Peek Newsletter. Subscribe now for early access to exclusive content, in-depth analysis and key trends!
International conflicts and trade disruptions continue to reverberate across industries that rely heavily on imports. Yet tariffs, the Iran conflict and shipping constraints in the Red Sea and the Panama Canal have not produced a broad pullback in U.S. cargo volumes.
Ports covered by the Global Port Tracker are expected to handle 25.7 million 20-foot equivalent units (TEUs) in 2026, 1 percent more than in 2025, according to the National Retail Federation and Hackett Associates. Tariff increases, inflation and higher fuel prices related to the Iran conflict have not significantly suppressed imports so far.
The more visible impact is on how goods enter and move through the country. Companies are spreading risk across ports, border crossings and inland routes, while adjusting sourcing, inventory and distribution strategies.
For industrial real estate, the question is which of these changes will create durable demand and which merely reflect short-term cargo diversions or tariff-driven front-loading. The answer differs by disruption. The Iran conflict is affecting U.S. commercial real estate primarily through energy and freight costs, while tariffs and sourcing shifts have broader implications for distribution networks, manufacturing locations and long-term space requirements.
A multi-gateway logistics map
Uncertainty at major maritime chokepoints is strengthening the case for flexible supply chains, though the impact on shipping routes and costs shifts as operating and security conditions change.
The Panama Canal reduced daily transit slots in September after drought and below-average rainfall lowered water levels. More recent precipitation and water-saving measures have since improved the outlook, and the canal plans to increase capacity to 33 daily slots beginning Oct. 15. Vessels without reservations may still face delays, underscoring the uncertainty shippers must account for even when conditions improve.
Red Sea conditions have produced similar reversals. In March, Maersk rerouted its service connecting the Middle East and India with the U.S. East Coast around the Cape of Good Hope after suspending Trans-Suez sailings through the Bab al-Mandab Strait. The carrier subsequently announced that the service would return to the Red Sea and Suez Canal route beginning in August, shortening westbound transit times by an average of seven days.
Such changes illustrate why occupiers are reluctant to rely too heavily on any single route. According to an April report from the United Nations Conference on Trade and Development, maritime disruptions have reconfigured shipping networks, prompted vessel diversions and contributed to higher, more volatile freight rates.
READ ALSO: Is Industrial CRE Benefiting From Tariffs and Reshoring?
The effects are visible in U.S. cargo flows, but they have not produced one clear coastal winner. West Coast ports captured 45 percent of U.S. containerized imports in July, up from 44.6 percent in June, according to a Descartes Global Shipping report. East and Gulf Coast ports increased their combined share to 39.8 percent from 39.6 percent.
Moving Chinese imports through West Coast ports—particularly Los Angeles and Long Beach—remains efficient, said JLL Vice Chair Rich Thompson, but companies are also sourcing goods from Vietnam, India and Mexico. And as those relationships evolve, occupiers are weighing gateway access against transportation costs and increasingly considering more affordable inland logistics hubs.
Most major ports continue to record volume gains. Eleven of 15 tracked by Savills posted year-over-year increases, although performance varied considerably. Baltimore reported the largest percentage gain, partly reflecting comparisons with the period affected by the previous year’s bridge collapse, while the Port of Virginia recorded the steepest decline. Savills’ import-volatility index reached 19.1 percent in Long Beach and 16.9 percent in Los Angeles.
Those fluctuations matter to warehouse markets, but cargo growth alone does not guarantee stronger fundamentals. The effects depend on how freight connects with inland distribution, manufacturing and the amount of industrial supply already delivered.
Uneven benefits across logistics markets
Mexico has emerged as one of the biggest beneficiaries of changing sourcing patterns, helping make Laredo, Texas, one of the three busiest U.S. ports of entry, Thompson noted. But the related industrial demand expands well beyond the border. Dallas recorded 17 million square feet of net absorption in the first half of 2026, supported by an expanding manufacturing base and increased cross-border freight volumes from Mexico, according to Lisa DeNight, Newmark managing director & head of North American industrial research.
Savannah provides another example. Its container volume has grown 24 percent since 2019, one of the strongest rates among East and Gulf Coast ports. Infrastructure investment and a shift toward sourcing partners such as India have improved its position, but industrial development has moved faster than tenant demand.
“The market front-loaded supply harder than almost anywhere else in the country, which is exactly why it’s currently sitting at one of the highest vacancy rates nationally, even as its underlying trade-lane story keeps improving,” DeNight said.
READ ALSO: Can Policymakers Outrun Tariff Turbulence?
Houston faces a similar test. Speculative development has expanded in its port-driven submarket after the Port of Houston handled a record number of TEUs last year, accounting for nearly all container traffic in Texas and more than two-thirds of U.S. Gulf Coast container volume.
The character of demand changes as goods move inland. Facilities nearest the port typically serve importers, exporters, manufacturers and logistics providers, while locations farther inland attract regional distribution, e-commerce and consumer-focused logistics operations, Mary Doetterl, research director at Lee & Associates, told Commercial Property Executive in July.
That network could benefit from further growth, but uncertainty surrounding the United States-Mexico-Canada Agreement remains a risk, particularly for advanced manufacturing supply chains in which components often cross borders multiple times before final assembly.
Together these markets show why gateway diversification does not translate uniformly into warehouse performance. Trade connectivity can support demand, but it’s existing supply, occupancy costs and links to manufacturing and population centers that determine how much of that activity ultimately reaches the industrial market.
Temporary inventory or durable CRE demand?
Current trade and shipping volatility is generating some warehouse demand, but it is also the latest in a series of shocks since 2020, DeNight said. Savills expects container volumes to ease or remain flat as tariff-driven front-loading fades.
“As shocks grow larger and more frequent, their cumulative weight is driving permanent shifts in how occupiers think about their space, locations and cost, reshaping strategy around a single organizing principle: resiliency,” DeNight noted.
That distinction between temporary inventory demand and structural change is unfolding as the broader industrial market moves toward normalization. Leasing reached 175.7 million square feet in the second quarter, up 49.4 percent year-over-year, while net absorption totaled 99.1 million square feet, nearly twice the previous quarter’s level, according to a JLL report. Vacancy declined 60 basis points to 6.8 percent, even as the construction pipeline grew 9.2 percent year-over-year to 276 million square feet underway at mid-year.
Reshoring and domestic manufacturing provide clearer evidence of durable demand. Manufacturing-related leasing has accounted for a structurally higher share of activity since 2023, DeNight noted, while manufacturing facility deliveries reached an all-time high in 2026.
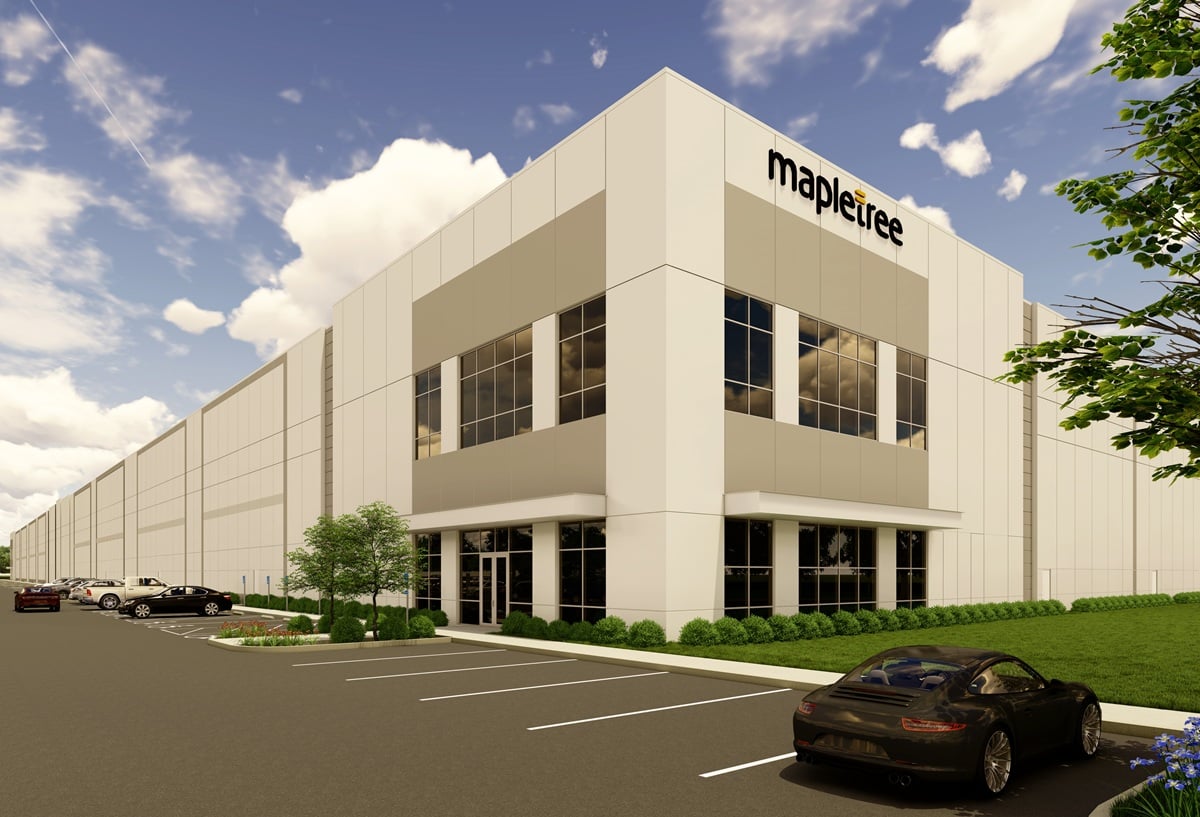
Some developers are responding by maintaining or expanding their U.S. pipelines. Mapletree has assembled roughly $500 million in industrial projects nationwide that it plans to place into a new fund targeting more than $1 billion, according to U.S. CEO Richard Prokup.
“Our development strategy was driven by the conviction that the supply of Class A warehouse space would tighten, creating favorable conditions for rental growth and absorption,” Prokup said. “In many respects, tariffs and broader geopolitical disruptions have only reinforced that demand.”
The durability of that demand will depend on whether manufacturers and distributors permanently alter their sourcing, production and distribution networks.
Iran’s deep but narrow effects
Compared with trade policy, the Iran conflict has a more concentrated direct effect on U.S. imports. Only 2.8 percent of total U.S. maritime imports by weight passed through the Strait of Hormuz during the 12 months ending in March, according to a Descartes report. However, exposure is substantially larger for certain industrial inputs. Shipments through the strait represented 17.5 percent of U.S. maritime fertilizer imports and 20 percent of imports of aluminum and aluminum products during the same period.
The broader real estate effect is coming through energy and transportation costs. Brent crude oil averaged $91 per barrel in August, $7 more than in July, according to the U.S. Energy Information Administration. The agency expects prices to average roughly $90 per barrel during the second half of 2026 as export constraints and falling global inventories keep oil prices elevated.
The agency also expects Middle East oil production to increase as more shipments move through Hormuz or use alternative routes. Even so, it forecasts that some export constraints will persist through year-end, keeping regional production below pre-conflict averages until the second quarter of 2027.
READ ALSO: Why CRE Fundamentals Outlast Geopolitics
For occupiers, higher energy prices feed directly into freight expenses. That can strengthen the case for locating inventory closer to customers, sourcing and producing goods within the same region or shifting more freight to lower-cost alternatives such as intermodal transportation, according to Thompson.
The conflict may therefore accelerate decisions involving facility location and transportation efficiency, but its direct exposure remains concentrated. Tariffs and sourcing changes have greater potential to redraw U.S. industrial networks across multiple markets.
Other forces reshaping demand
Beyond trade policy and maritime disruptions, there are other forces influencing port and inland industrial markets. The AI infrastructure build-out is one of the largest emerging sources of industrial demand in a generation, DeNight noted, and it increasingly overlaps with reshoring and domestic manufacturing.
Link Logistics Research estimates that every gigawatt of data center construction can generate roughly 2 million square feet of spillover industrial demand, much of it tied to long-term operations rather than temporary construction staging.
As these forces converge, the markets best positioned to capture demand are those that offer more than access to a single port. Multiple gateways, affordable inland distribution, rail and highway connectivity, power availability and modern industrial facilities all strengthen a region’s ability to absorb supply-chain shifts.
Maritime disruptions and the Iran conflict may speed up strategies already underway, but trade policy, manufacturing expansion and the broader reorganization of supply chains are more likely to determine where durable industrial demand emerges.




You must be logged in to post a comment.