








The Inland Empire Expands
Multifamily rent growth in San Bernardino and Riverside counties continued its extremely fast pace over the past year, supported by a healthy job market and moderate inventory expansion, Yardi Matrix data shows.
Steady San Diego
Rents were up 4.8 percent in the year ending in March, continuing to outperform the national average, Yardi Matrix data shows. And at 96.8 percent, the metro’s occupancy rate is one of the highest in the country.
Direct Private Real Estate Returns
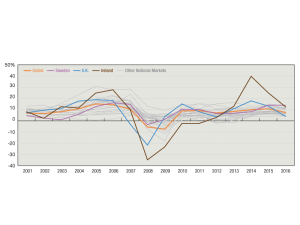
In the earlier part of the decade, the UK market had been one of the strongest performers but in a precipitous decline aided by the Brexit referendum result, the country recorded the lowest total return in the Global index at 3.9 percent in 2016.
Development
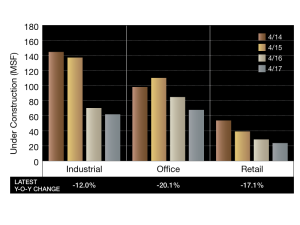
The percentage of industrial under construction decreased by 7 percent, followed by the decrease of 5.2 percent for retail construction, compared to March 2017.
Industrial Demand
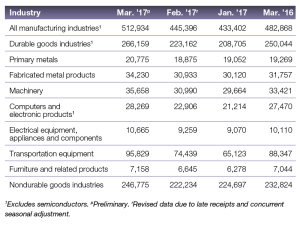
The most significant changes included Transportation Equipment up 8.5 percent, followed closely by Primary Metals and Fabricated Metal Products, with an increase of 7.8 percent.
REITs
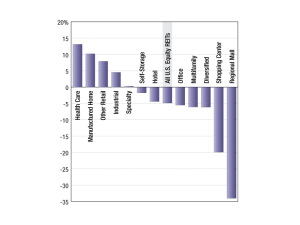
The Health Care REIT sector traded at the largest median premium to NAV, at 13.10 percent. Manufactured Home and the other Retail REIT sectors followed next trading at median premiums to NAV of 10.19 and 7.92 percent, respectively.
Top 5 Retail Space and Office Building Sales
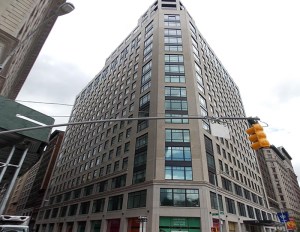
PropertyShark compiled the top 5 sales in office and retail for April 2017 in New York City.
Investment
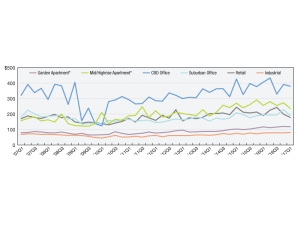
The industrial sector had the smallest price per square foot, at $81,000, but increased by 4 percent over the first quarter of 2016.
Employment Picture
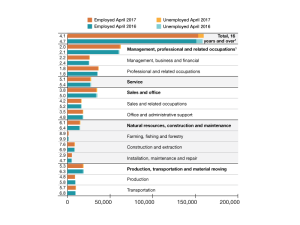
Year-over-year, the largest difference for employment was once again in the Farming, Fishing and Forestry occupations, with a rise of 10 percent.
You must be logged in to post a comment.