Global
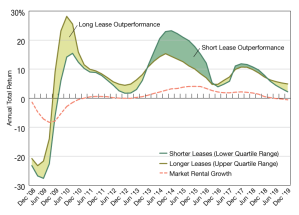
U.K. Quarterly Property Index
This analysis, using data from the MSCI UK Quarterly Property Index, shows lease length has historically been one such cyclical factor.
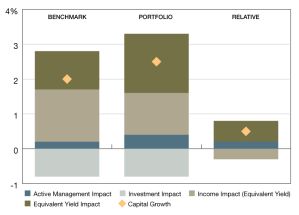
Capital Growth
Could breaking capital growth into its components help tell a more detailed story of property portfolios’ performance?
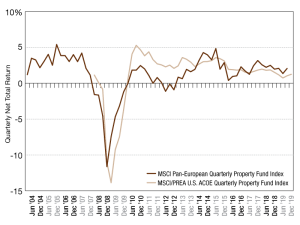
Pan-European vs. U.S. Funds
Pan-European funds underperformed compared to U.S. funds in the years following the financial crisis and during the European Sovereign debt crisis, but that in more recent years, Pan-European fund returns have been out-performing U.S. funds.
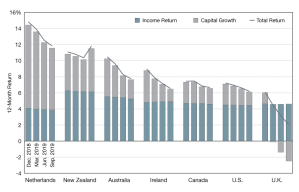
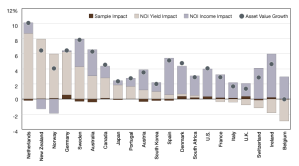
General Softening Trend in 2019
Across most of these markets, there was a softening in total returns, as capital growth moderated.

Largest Exposure by State
Climate related weather events can increase operational costs, devaluate property, and in some extreme cases, lead to asset stranding.
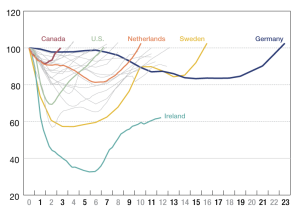
Asset Value Index
While downturns may be hard to escape, diversification and income returns have in the past provided investors with some protection.
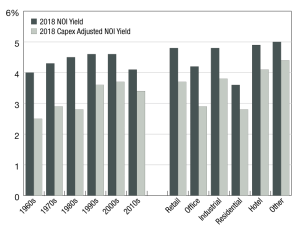
NOI vs. Capex Yield
Variables such as age, location and property type can influence how much capex is required to operate an asset.
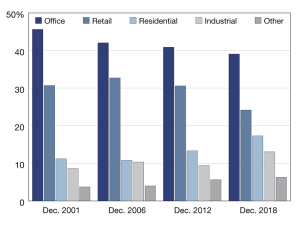
Global Annual Property Index
In 2001, office and retail accounted for 46 and 31 percent, respectively, of capital value in the MSCI Global Annual Property Index. However, now they account for less than two-thirds.

Sales Price
While retail had the lowest premium across the sectors in 2018, it was in line with its 20-year average, as were the office and residential sectors.
Global Annual Property Index
As interest rates have fallen, the discount rates on real estate cash flows have followed, helping to drive up asset values.