

Global Annual Property Index
As interest rates have fallen, the discount rates on real estate cash flows have followed, helping to drive up asset values.
2018 Growth/Impact
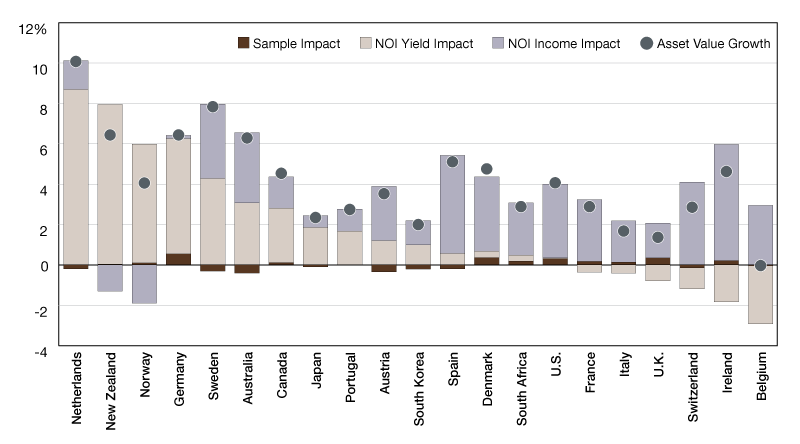
Source: MSCI
In the nine years since the financial crisis, asset values in the MSCI Global Annual Property Index have risen by 45 percent. Asset values continued to increase in 2018 everywhere except Belgium, where they were flat. But what has driven asset value growth in 2018?
Asset value growth can be driven by market sentiment (changes in yields) or by more fundamental changes in rental markets (income growth). Decomposing asset value growth in this way can help to shed light on the state of a market. In this chart, we use data from the MSCI Global Annual Property Index to compare how much asset value growth was recorded in various national markets in 2018, how much of that can be attributed to Net Operating Income (NOI) growth, and how much can be attributed to changes in NOI yields.
A substantial amount of post-crisis asset value growth has been driven by yield compression. As interest rates have fallen, the discount rates on real estate cash flows have followed, helping to drive up asset values. For some countries, especially some of those with the highest asset value growth, yield compression continued to drive asset values in 2018. But for other markets, such as Ireland, yield pressure has slowed or reversed and NOI growth has become a more significant driver of asset values.
Insights and data provided by MSCI Real Estate, a leading provider of real estate investment tools. A Vice President in MSCI’s global real estate research team, Reid focuses on performance measurement, portfolio management and risk related research for asset owners and investment managers. Based in Sydney, he covers APAC as well as global markets.


You must be logged in to post a comment.