REITs
2020 REIT Trading Trends
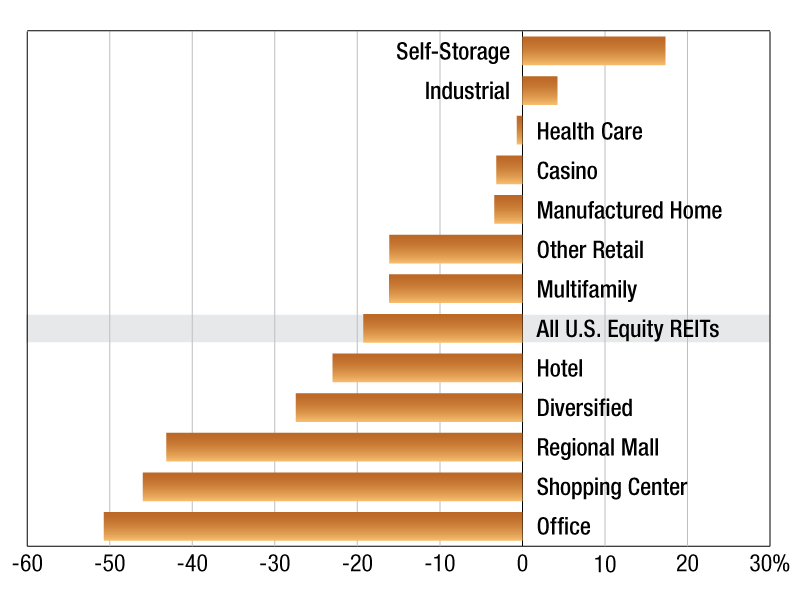
As of Oct. 30, 2020, publicly listed U.S. equity REITs traded at a 19.3 percent median discount to estimated net asset value.
2020 REIT Values
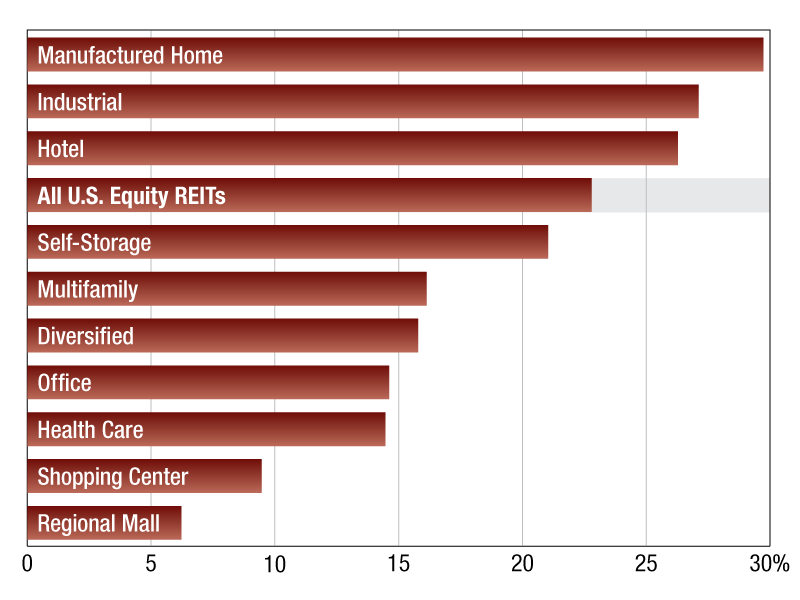
As of Sept. 30, the manufactured homes sector led all publicly traded U.S. equity REIT sectors in terms of the funds from operations multiple for the last 12 months.
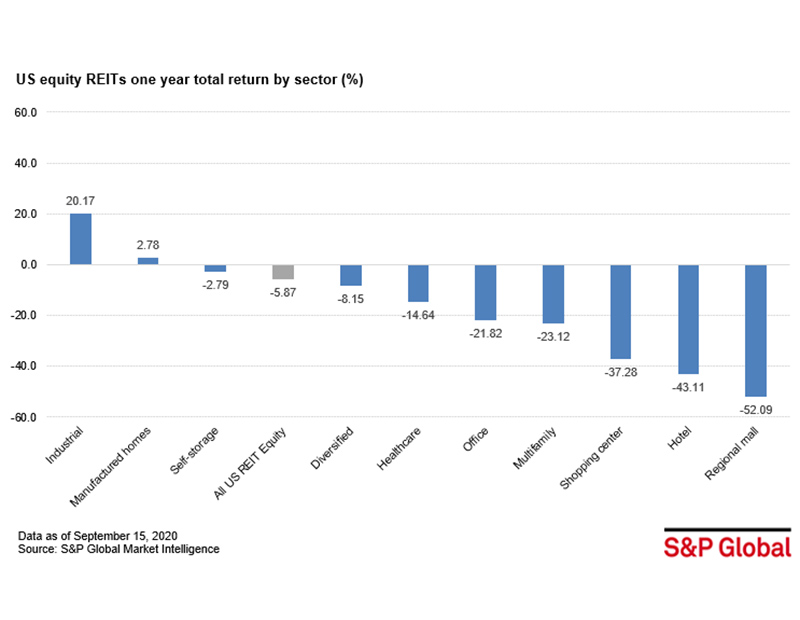
2020 REIT Total Returns
Hotel and retail REITs dragged down year-over-year returns for the sector.
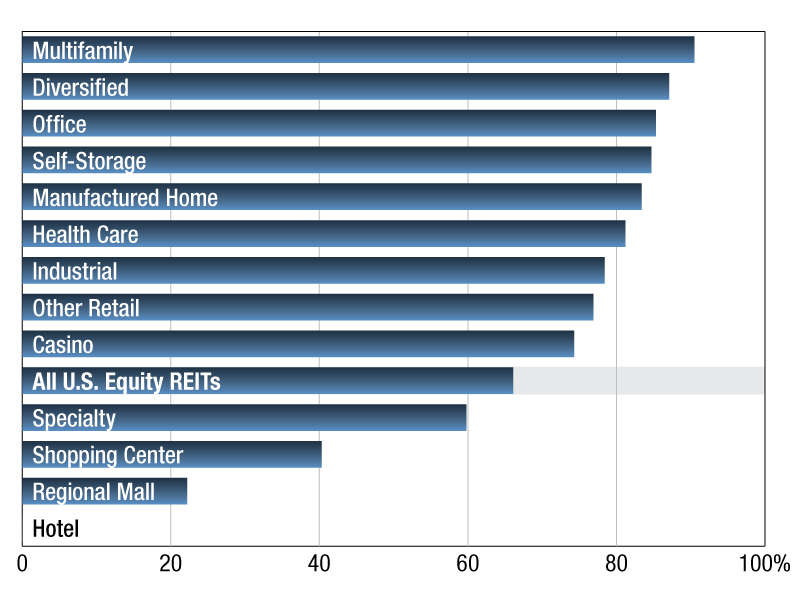
2020 REIT Results
Among the sectors, multifamily REITs had the highest average AFFO payout ratio estimate for the third quarter of 2020, at 90.5 percent.
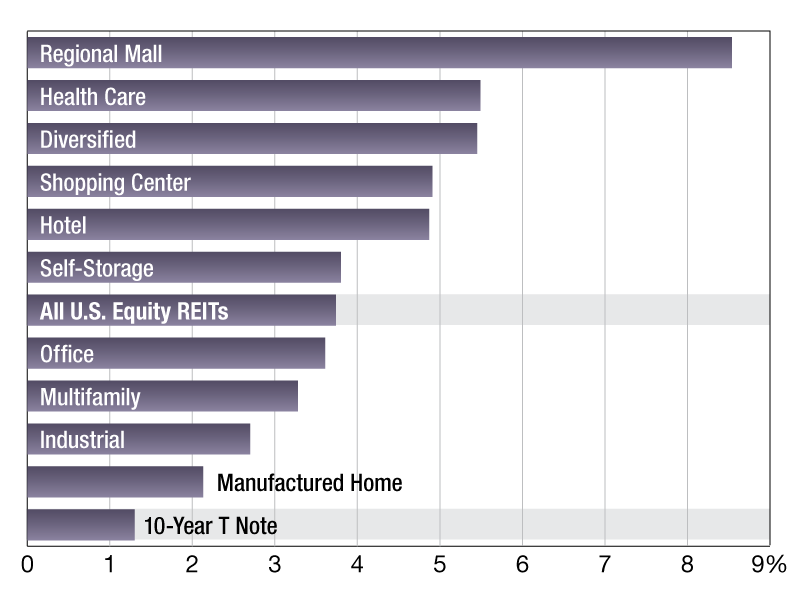
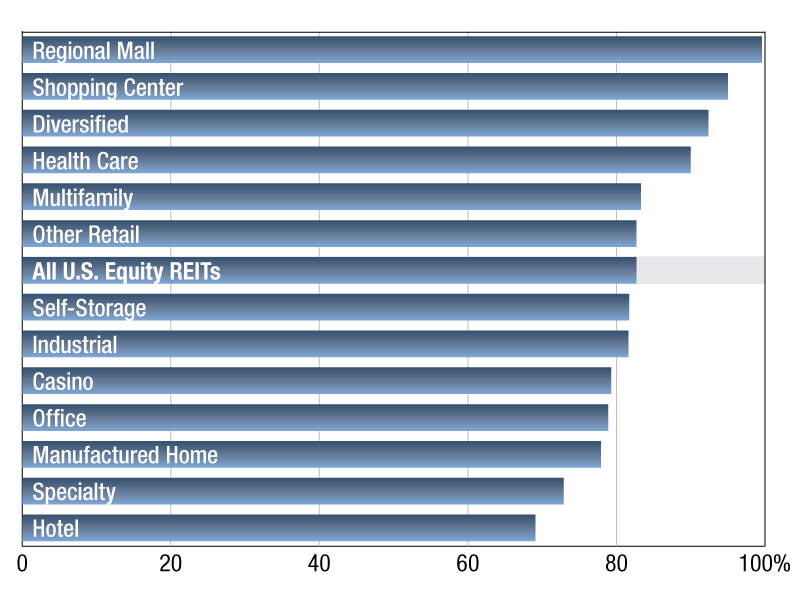
2020 REIT Dividend Yields
The regional mall REIT sector recorded the highest one-year average dividend yield among the group.
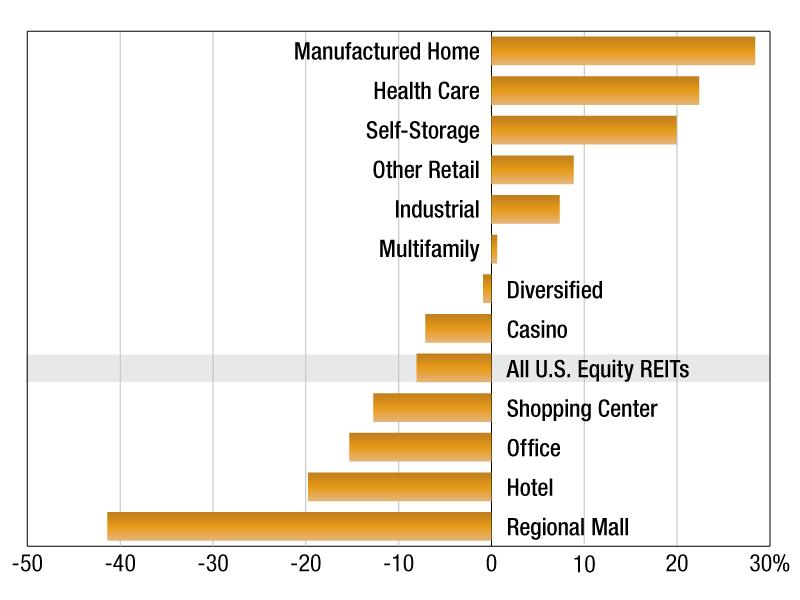
2019 REIT Trading Trends
The Manufactured Home sector traded at the greatest median premium to NAV, at 28.4 percent.
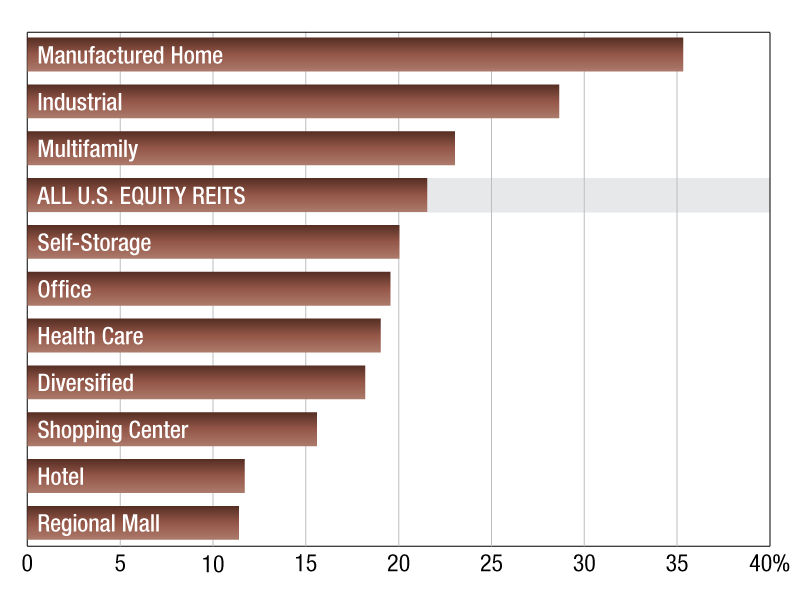
2019 REIT Values
The manufactured homes sector led all publicly traded U.S. equity REIT sectors in terms of the last 12 months.
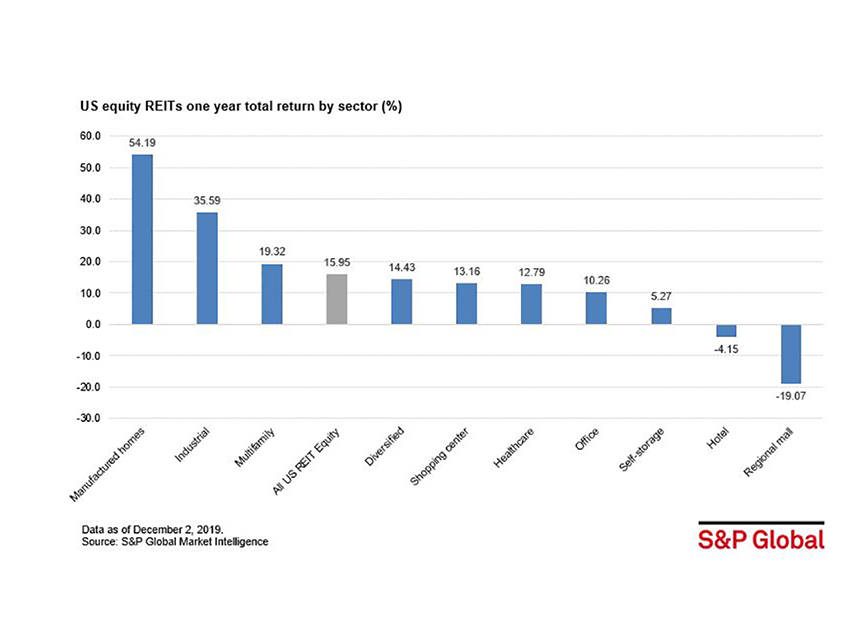
Retail REIT Returns Down 19% Y-O-Y
The manufactured homes REIT sector topped the chart with a 54.2 percent total return, according to S&P Global Market Intelligence.
2019 REIT Results
Among the sectors, hotel REITs had the lowest average payout ratio estimate for 2019.