

2019 REIT Results
Among the sectors, hotel REITs had the lowest average payout ratio estimate for 2019.
U.S. equity REIT average AFFO payout ratios
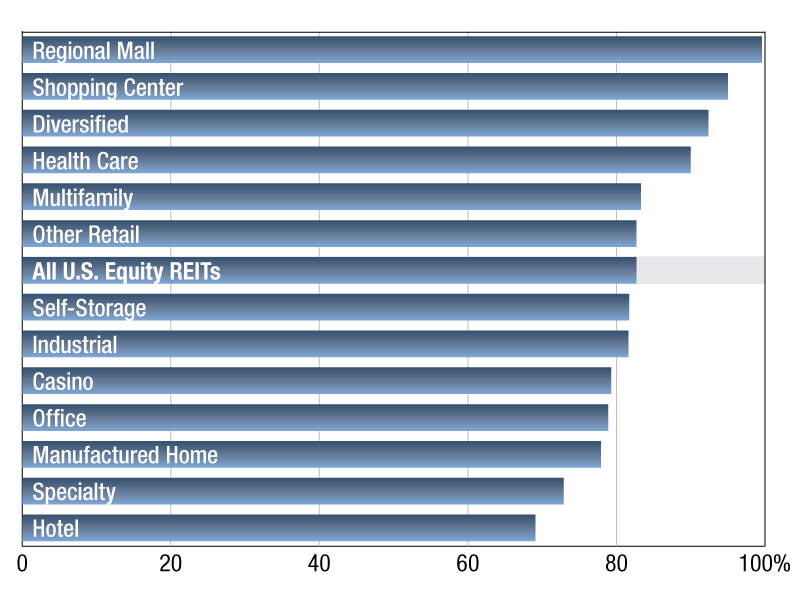
As of Nov. 1, 2019.
Source: S&P Global Market Intelligence
As of November 1, publicly traded U.S. equity REITs had an average 2019 AFFO payout ratio estimate of 82.7 percent.
Among the sectors, regional mall REITs had the highest average AFFO payout ratio estimate for 2019, at 99.6 percent. The shopping center and diversified sectors followed at 95.0 percent and 92.4 percent, respectively. On the other hand, hotel REITs had the lowest average AFFO payout ratio estimate for 2019, at 69.1 percent.
The multifamily REIT sector had a 83.3 percent for 2019 year AFFO payout ratio estimate as of November 1. Among the multifamily REITs, BRT Apartments Corp. was on top of the list with a 111.9 percent AFFO payout ratio estimate. Following next was Independence Realty Trust Inc. with a 109.4 percent payout ratio estimate. NexPoint Residential Trust was at the bottom of the list with a 58.0 percent payout ratio estimate.
Aftab Alam is a senior associate in the real estate client operations department of S&P Global Market Intelligence.
—Posted on Nov. 18, 2019
U.S. equity REIT average AFFO payout ratios
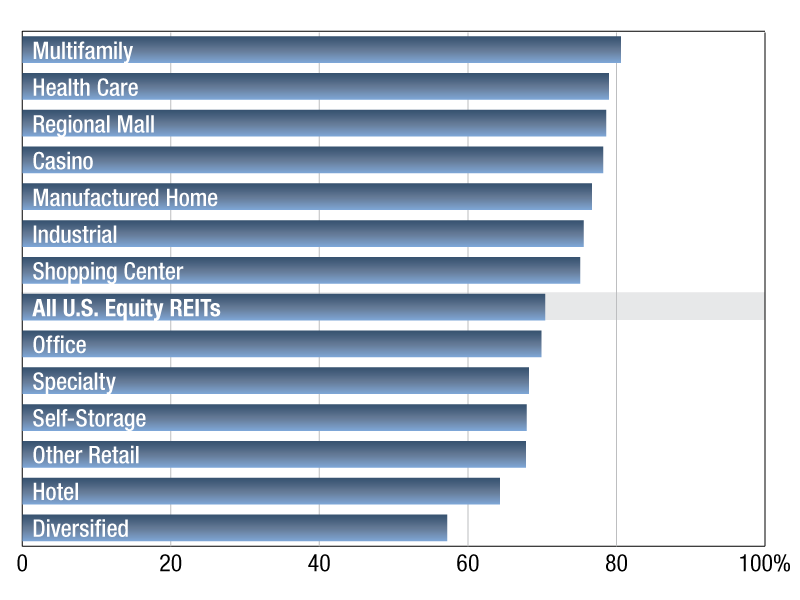
As of June 3, 2019.
Source: S&P Global Market Intelligence
As of Jun. 3, publicly traded U.S. Equity REITs had an average 2019 AFFO payout ratio estimate of 70.4 percent. Among the sectors, Multifamily REITs had the highest average AFFO payout ratio estimate for 2019, at 80.6 percent. The Health Care and Regional Mall sectors followed at 79.0 percent and 78.6 percent, respectively. On the other hand, Diversified REITs had the lowest average AFFO payout ratio estimate for 2019, at 57.2 percent.
The Multifamily REIT sector had a 80.6 percent current year AFFO payout ratio estimate as of June 3. Among the Multifamily REITs, Independence Realty Trust Inc. was on top of the list with a 109.9 percent AFFO payout ratio estimate. Following next was Bluerock Residential Growth REIT Inc. with a 104.8 percent payout ratio. NexPoint Residential Trust was at the bottom of the list with a 53.0 percent payout ratio.
Carter Phillips is an associate in the real estate client operations department of S&P Global Market Intelligence.
—Posted on June 20, 2019
U.S. equity REIT average AFFO payout ratios
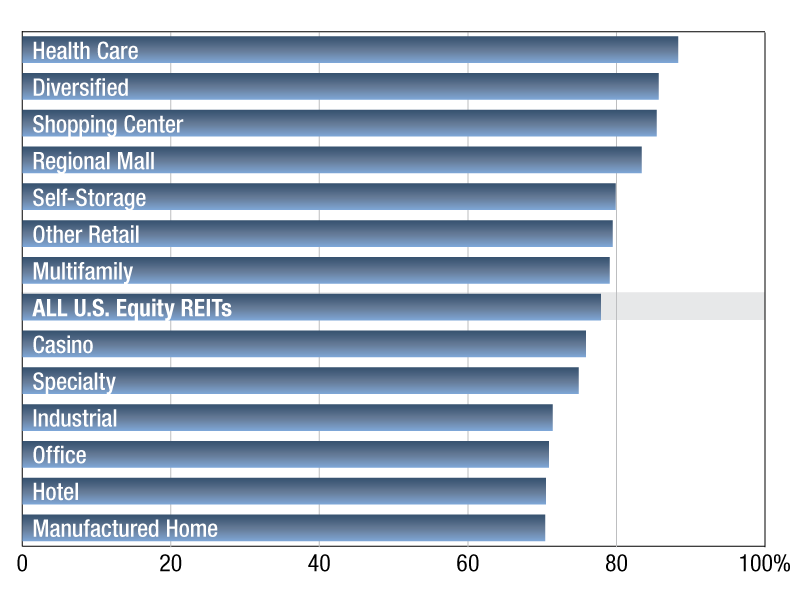
As of Jan. 3, 2019.
Source: S&P Global Market Intelligence
As of Jan. 3, publicly traded U.S. Equity REITs had an average AFFO payout ratio estimate of 77.9 percent. Among the sectors, Health Care REITs had the highest average AFFO payout ratio estimate for 2019, at 88.3 percent. The Diversified and Shopping Center sectors followed at 85.7 percent and 85.4 percent, respectively. On the other hand, Manufactured Home REITs had the lowest average AFFO payout ratio estimate, at 70.4 percent.
The multifamily REIT sector had a 79.1% current year AFFO payout ratio estimate as of January 3.
Among the Multifamily REITs, BRT Apartments Corp. was on top of the list with a 129 percent AFFO payout ratio estimate. Following next was Independence Realty Trust Inc. with a 101.8 percent AFFO payout ratio estimate.NexPoint Residential Trust was at the bottom of the list with a 53.4 percent AFFO payout ratio estimate.
Carter Phillips is an associate in the real estate client operations department of S&P Global Market Intelligence.
—Posted on Jan. 11, 2019


You must be logged in to post a comment.