

Office Report: As Vacancy Eases, Coworking Bridges the Gaps
Available space decreased in 2025. However, it is still unclear how far this trend will go.

Vacancy rates across most major office markets rose sharply for several years, but 2025 marked a turning point, according to the latest Yardi Matrix national office report.
The national vacancy rate peaked in March last year and has since declined by 150 basis points to 18.4 percent as of December 2025.
Manhattan emerged as the earliest and strongest bright spot in the nation, with vacancy falling by more than 400 basis points from its 2023 peak. Other major markets followed, reaching peak vacancy in late 2024 or early 2025 before beginning to reverse. While vacancy rates may continue to edge lower, they are unlikely to return to pre-pandemic levels given lasting shifts in workplace behavior and office-use policies.
Monetary policy has also begun to shape market conditions. In December 2025, the Federal Reserve cut interest rates by 25 basis points, with two additional cuts expected to happen over the next three quarters. Lower borrowing costs could help revive the stalled construction pipeline while also encouraging more discounted office transactions.
READ ALSO: $100B in CMBS Loans Mature This Year. Here’s What’s Ahead.
Lower interest rates combined with discounted pricing are also improving the feasibility of office conversions. Yardi’s Conversion Feasibility Index ranks office properties by conversion potential, with Tier I assets representing top candidates and Tier II buildings requiring some adjustments. Nationwide, 23.4 percent of office inventory falls into Tier I or Tier II, presenting a sizable opportunity for developers.
Coworking continued to expand its role in the office sector in 2025. Operators added more than 1,000 locations and increased flex space’s share of total office inventory to 2.2 percent. The sector has filled a growing gap for companies avoiding the cost of long-term leases while remaining reluctant to adopt fully remote models, positioning coworking as a viable alternative and a potential solution for owners of underperforming assets.
The national office vacancy rate stood at 18.4 percent in December 2025, down 10 basis points from the prior month and 140 basis points year-over-year. Vacancy declined across 17 of the top 25 U.S. office markets during the past year, signaling broader stabilization.
Several metros recorded the steepest improvements, including Houston (-430 basis points), San Francisco (-370 basis points), the Bay Area (-320 basis points), and Manhattan (-300 basis points). On the flip side, Orlando (310 basis points) and San Diego office space (270 basis points) posted notable year-over-year increases.
Austin and Seattle continued to post the highest vacancy rates in December 2025, at 27.3 percent and 27.2 percent, respectively. In contrast, Manhattan recorded the lowest vacancy rate nationwide at 13.6 percent.
Asking rents showed modest movement. The national average full-service equivalent listing rate reached $32.86 per square foot—up 9 cents from the previous month but down 0.8 percent year-over-year. Manhattan remained the most expensive office market for rents, at $68.15 per square foot average, followed by San Francisco at $63.15 per square foot. On the opposite end was Detroit, with the lowest average rent in the country, at $21.46 per square foot.
Deliveries reach multiyear lows, pricing finds a floor
Developers continued to limit new office construction nationwide. As of December, the U.S. office pipeline totaled 30.9 million square feet, representing 0.4 percent of existing inventory and a 44 percent decline from January 2024, when 54.7 million square feet were underway. Office completions totaled only 42.4 million square feet, marking the second consecutive year of falling completions and another historic low for the decade.
Boston again led the nation in development activity with 4.4 million square feet under construction, followed by Manhattan with 2.3 million square feet underway. Construction starts leveled off further, with 13.2 million square feet breaking ground in 2025—slightly below the 13.5 million square feet started in 2024. While the shift toward hybrid work continues to influence office demand, tenants remain active, favoring smaller, amenity-rich buildings over large, traditional office footprints.
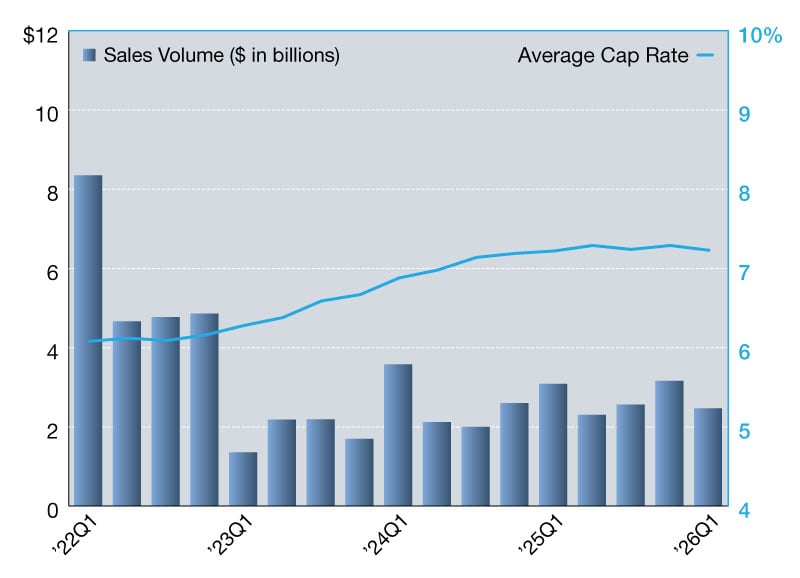
Office investment activity reached $53 billion by the end of December 2025, with properties trading at an average sale price of $192 per square foot. Manhattan led the nation in sales volume with $7.8 billion in transactions, while the Bay Area ranked second with $4.8 billion.
The Bay Area stood out throughout 2025 for both deal flow and pricing strength. Investor activity fluctuated during the year but frequently outpaced other gateway markets. The metro recorded 119 transactions—the highest annual total since 2021. Office assets sold at an average of $392 per square foot in December, the second-highest price in the nation and marking a 35 percent year-over-year increase—the first annual price gain in the market since 2021.
Read the full Yardi Matrix office report.
You must be logged in to post a comment.