Investment (Research Center)
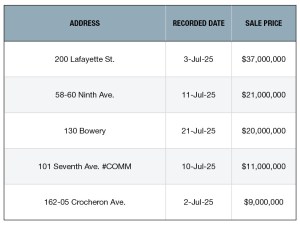
Top 5 NYC Retail Building Sales—July 2025
PropertyShark collected the city’s top deals for the sector.
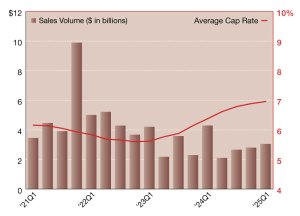
2025 Retail Net Lease Sales Volumes and Cap Rates
How the sector is faring, according to the most recent data. Read the report.
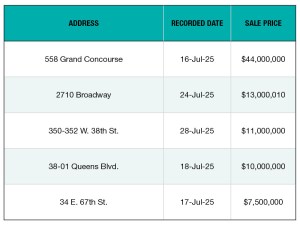
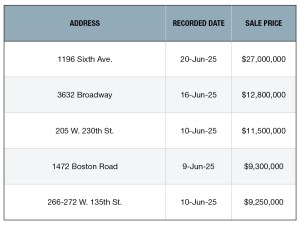
Top 5 NYC Office Building Sales—July 2025
PropertyShark collected the city’s top deals for the sector.
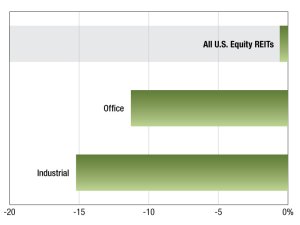
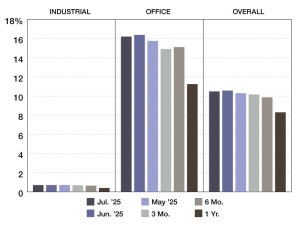
2025 REIT Returns
The Dow Jones Equity All REIT Index’s latest update on performance from S&P Global Market Intelligence. Read the report.
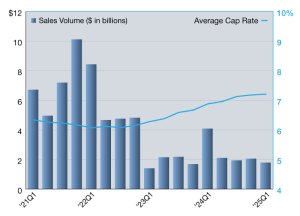
2025 Office Net Lease Sales Volume and Cap Rates
How the sector is faring, according to the most recent data. Read the report.
Top 5 NYC Retail Building Sales—June 2025
A roundup of recent major transactions put together by PropertyShark.
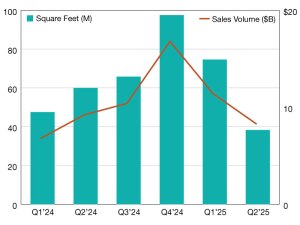
2025 Office Investment Update
Property prices rose 15 percent compared to the first quarter, according to Yardi Research Data.
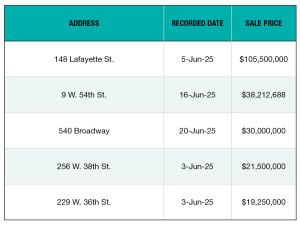
Top 5 NYC Office Building Sales—June 2025
A roundup of recent major transactions put together by PropertyShark.