


Office Discounts Create Conversion Opportunities
Office values continue to slide, fueling a growing wave of office-to-multifamily redevelopments.
Dropping office values are creating new opportunities for office-to-multifamily conversions, making these projects more feasible as financial challenges diminished, according to the latest Yardi Matrix national office report.
The national office vacancy rate continued to decline but remained elevated at 17.7 percent as of June 2026. Office utilization has changed little, with in-office occupancy hovering around 55 percent over the past few years, according to Kastle’s Back to Work Barometer. Years of weak office attendance and mounting distress have driven property values lower, making discounted sales increasingly common. Since 2024, nearly half of office properties with multiple comparable sales have traded at a discount.
READ ALSO: How AI and Automation Are Shaping CRE: CoreNet Global Survey
Conversion activity accelerated as developers find bargains that offset costs associated with such projects. Last year, there were 11.8 million square feet of office-to-multifamily conversions underway or delivered, a higher number than any prior year. Yardi’s Conversion Feasibility Index shows 2 billion square feet of space as suitable for residential conversions. About 4.6 percent of that inventory falls into Tier I category.
Chicago stood out as one of the strongest markets for conversions . Since 2024, roughly 60 percent of all transactions traded at a discount, while 95 million square feet have been identified as suitable for residential reuse.
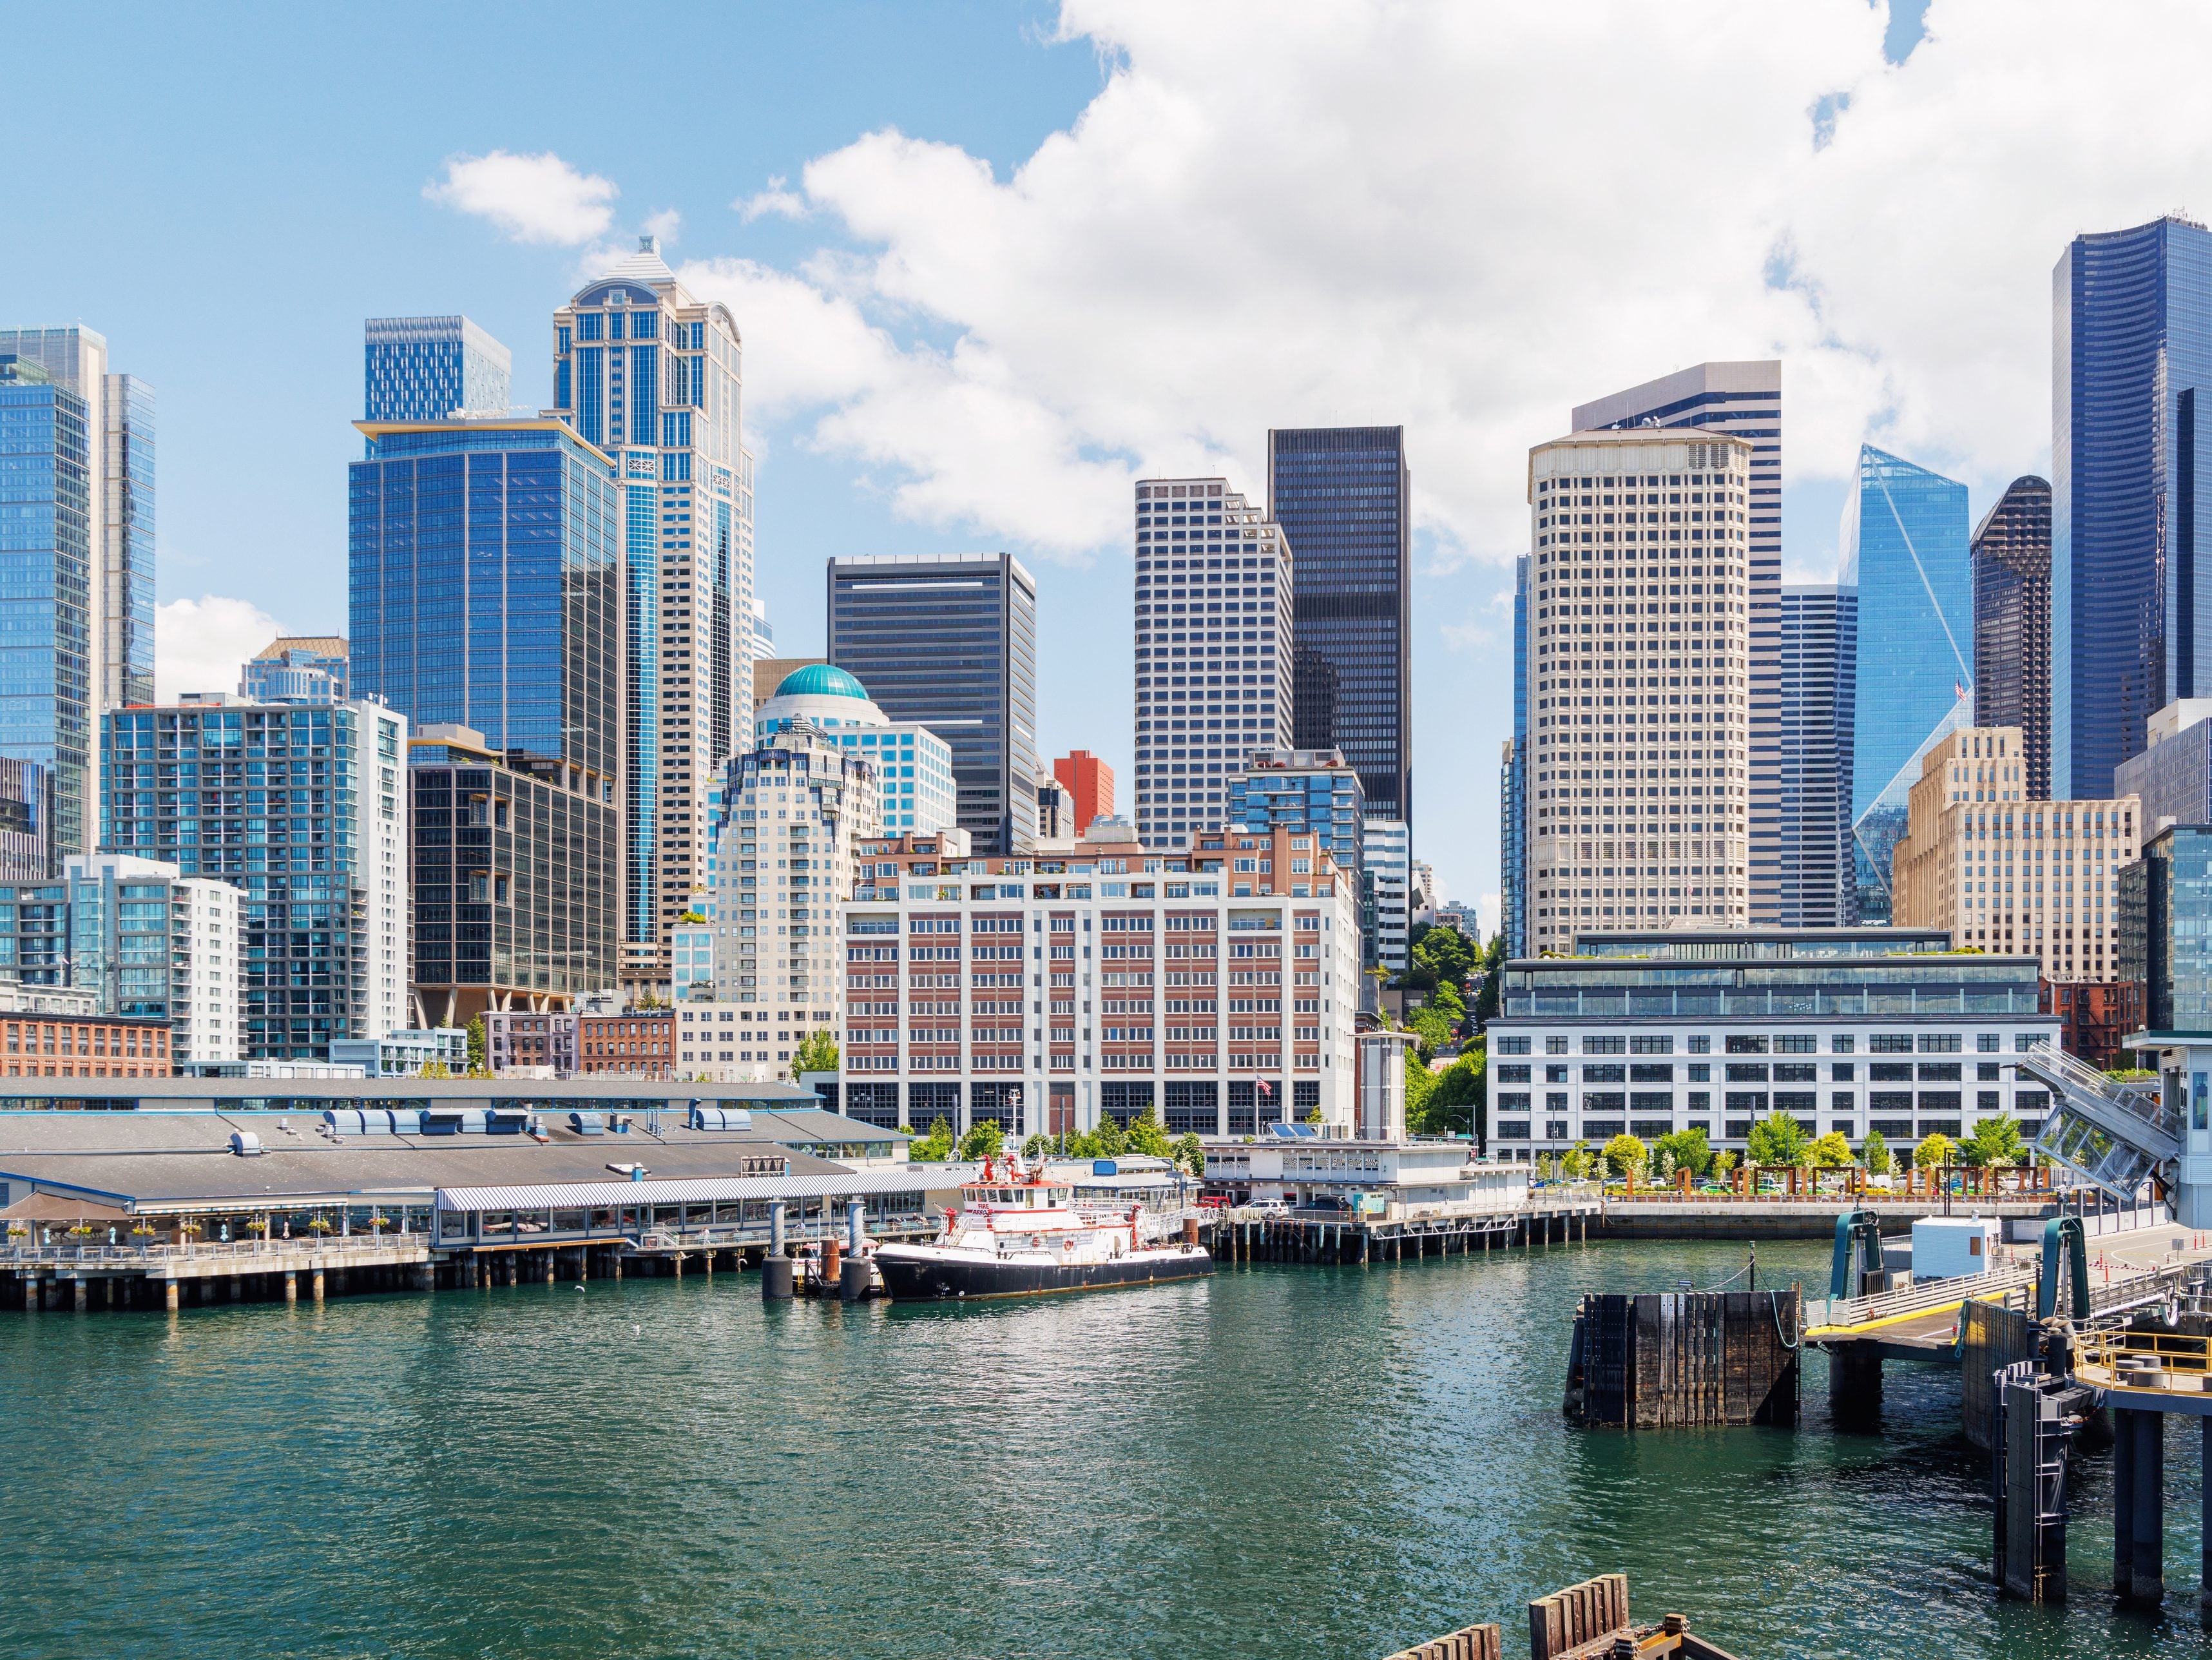
Seattle presents a contrasting picture. Although the metro has 47.5 million square feet of space suitable for residential conversions, redevelopment activity remained limited as the metro recorded one of the highest vacancy rates, at 24.7 percent.
The national office vacancy rate stood at 17.7 percent in June, down 170 basis points year-over-year. Portland posted one of the most highest rates in the nation, at 22.1 percent. Despite its rates declining over the past two years, the metro has remained above 20 percent since late 2024. Several corporate relocations, including U.S. Bank’s departure from the city, pushed Portland’s rate higher. Ongoing concerns about public safety also weighed on tenants looking for space in other areas.
Manhattan recorded the lowest rate nationally at 13.1 percent—210 basis points lower from a year ago. Miami followed with 13.2 percent and a 110-basis-point recovery.
The national average full-service equivalent listing rate stood at $33.67 per square foot in June—six cents higher from the previous month and down 2.4 percent year-over-year.
The highest listing rates in the country were recorded in Manhattan, at $72.02 per square foot. Metros that followed included San Francisco’s $65.13 per square foot and Miami’s $61.04 per square foot.
Limited pipeline, sales hold steady
The national under-construction pipeline comprised nearly 30 million square feet, accounting for 0.4 percent of existing stock. Year-to-date through June, office completions totaled 11.1 million.
Boston continued to lead the nation in office development with 3.4 million square feet underway, followed by Manhattan with 2.9 million square feet. Dallas ranked third with nearly 2.9 million square feet under construction. Although roughly 1 million square feet broke ground in the Metroplex during the past 12 months, its pipeline declined 11 percent year-over-year.
The U.S. office sector saw 1,296 transactions close as of June, with properties selling at a $195 per square foot average for a total of $30 billion. Manhattan remained the national leader for sales, with investors generating $4.3 billion. Dallas ($2.6 billion) and San Francisco ($2.4 billion) followed.
San Francisco stood out as the top market for office pricing, with assets sold at $609 per square foot on average. Manhattan’s $590 per square foot followed. Phoenix office prices increased over the past two years and reached $184 per square foot on average. Post-pandemic office values in the metro fared better than in other markets. In June, Fidelity Investments paid $51.5 million for a medical office building at 530 S. Val Vista Drive in Gilbert, Ariz. RX Health & Science Trust sold it and got a 56 percent gain over the property’s $33 million price from 2021.

You must be logged in to post a comment.