


2026 Placer.ai Office Index
The latest data on national and local office foot traffic trends.
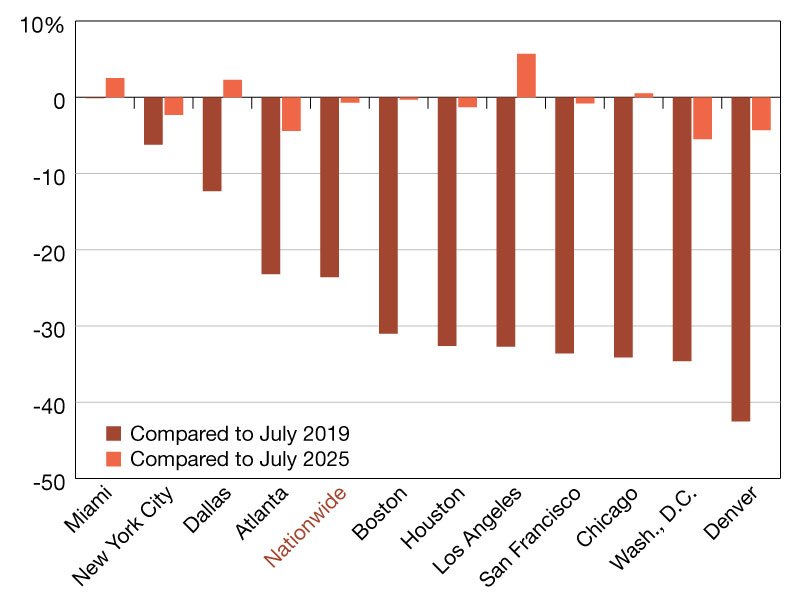
Nationwide office visits in July 2026 came in 23.6 percent below July 2019 and just 0.7 percent below July 2025, holding near their post-pandemic high despite extreme weather and World Cup disruptions.
Miami, New York and Dallas led the recovery relative to 2019, while Los Angeles posted the strongest year-over-year growth at 5.7 percent and Washington, D.C. and Denver continued to lag furthest behind.
Summer RTO momentum
The return-to-office push kept gathering steam this summer. On July 1st, California’s four-day-a-week in-office mandate for state employees came into effect, while EY became one of the latest major private employers to tighten its own in-person policy.
But July also brought significant commuting disruptions, from extreme weather early in the month to the FIFA World Cup hosted in major markets nationwide.
So where did office attendance land amid these competing forces? We dove into the data to find out.
Office visits hold near their post-pandemic high
Nationwide office visits in July 2026 were 23.6 percent below July 2019 and just 0.7 percent below July 2025 (all three months had the same number of working days). Visits also increased month over month in July, exceeding June 2026 in absolute terms. But because June had one fewer working day, it ranked slightly higher on a per-working-day basis. By that measure, July 2026 was the third-busiest in-office month since March 2020, behind June 2026 and July 2025.
Miami (-0.1 percent), New York (-6.2 percent), and Dallas (-12.3 percent) led the rankings relative to 2019 in July 2026, with Miami and Dallas also posting year-over-year gains. New York saw a modest 2.3 percent abbual decline, which may have been exacerbated by multiple heat emergencies. Atlanta also remained among the most recovered markets despite a 4.4 percent year-over-year decline, likely influenced by World Cup-related road closures and calls for employers to embrace WFH.
Los Angeles, which has ranked at or near the top of the year-over-year standings for several months, continued to lead on annual growth, with office visits up 5.7 percent. While some of the city’s recent gains may still reflect easier comparisons, its sustained strength increasingly points to genuine momentum—likely supported by stricter RTO policies at entertainment giants such as NBCUniversal. San Francisco’s AI-driven resurgence, meanwhile, helped keep the city in the middle of the rankings, even as visits remained 33.6 percent below 2019 levels. In both California hubs, the state-worker RTO mandate that took effect July 1 may be reinforcing the broader return-to-office trend.
Washington, D.C., and Denver, for their part, posted the largest post-pandemic office-visit gaps, with D.C.’s lag likely tied partly to a contracting job market and Denver’s to its remote-friendly work culture.
—Posted on August 28, 2026
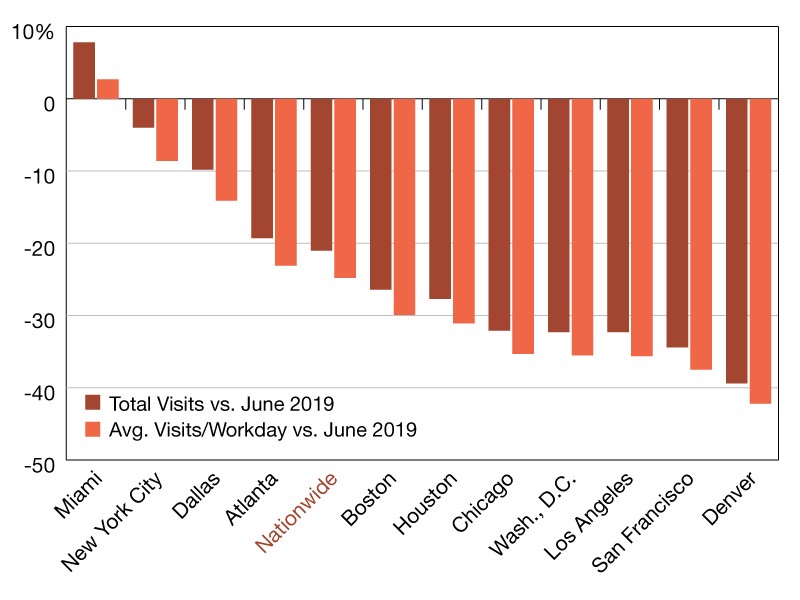
Nationwide office visits in June 2026 jumped 8.5 percent year-over-year and stood 21.0 percent below June 2019 levels. But June 2026 also came with a calendar assist: the month had 21 working days, compared to 20 in both June 2025 and June 2019. And Juneteenth fell on a Friday this year, rather than a Thursday as in 2025—meaning the holiday landed on what is typically the week’s quietest office day, likely blunting its drag on attendance.
On a per-working-day basis, office visits rose a more modest 3.3 percent year-over-year, continuing the slow but stubborn climb the index has traced for the past several months. Still, even when normalizing for business days, June emerged as the single busiest in-office month since COVID-19 began in March 2020.
Momentum across the board
Market-level data shows that many analyzed metros—including Atlanta, Boston, Chicago, Dallas, Houston, Los Angeles and Miami—reached new post-pandemic office attendance highs in June after adjusting for the number of working days. But Miami was the clear June RTO winner, with office visits surpassing 2019 levels. Critically, this is still an estimation, and it remains to be seen how Miami’s recovery will continue to play out over the long term. Still, the obvious takeaway is that the Florida hub—which has also seen the lowest vacancy rate of any major U.S. office market in recent months—is in an especially strong position as the RTO continues.
Every major market also posted year-over-year visit growth, with Los Angeles leading the pack. The market was lapping a soft June 2025, when local protests disrupted commuting routines—though L.A.’s solid showing in recent months suggests the jump reflects more than an easy comparison. San Francisco ranked second, continuing the momentum that made it the year-over-year growth leader in May. And Chicago also logged a substantial annual gain, moving into the middle of the post-pandemic recovery pack as its downtown office market recorded its first vacancy decline in fifteen quarters in the second quarter of 2026.
—Posted on July 28, 2026
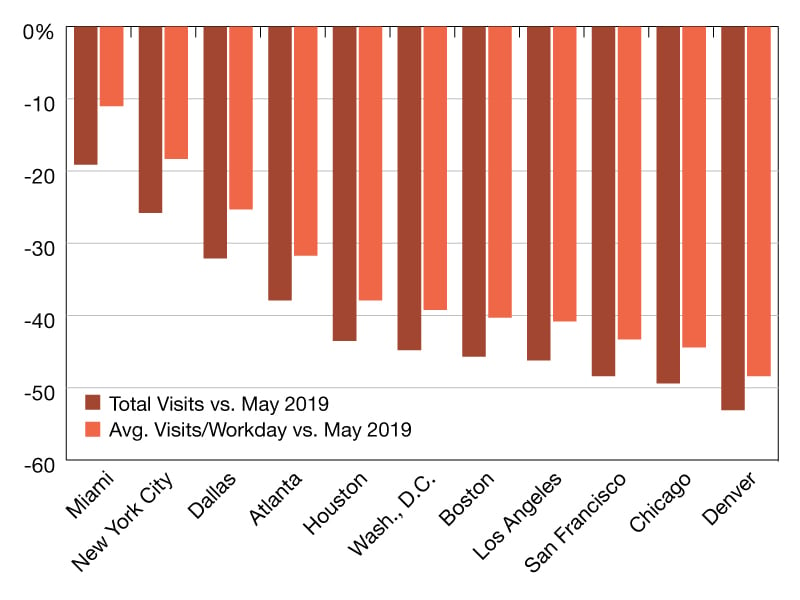
May 2026 office visits fell 1.2 percent year-over-year on a raw basis, but when normalizing for the number of working days, attendance rose 3.7 percent year-over-year.
On a per-working-day basis, visits stood 32.4 percent below the May 2019 baseline—a narrower gap than the 34.9 percent recorded in May 2025.
San Francisco again led all major markets year-over-year on the back of its AI-driven office leasing recovery, while Denver remained the furthest from its pre-pandemic baseline.
May 2026 brought a fresh round of return-to-office pressure—PNC Financial’s five-day mandate took effect at the start of the month, while EY told its U.S. tax teams to plan for more in-person time this summer. Both join a growing list of employers tightening face-time policies. At the same time, gas prices climbed to an average of $4.61 in May, making the commute more expensive for employees who drive to work.
San Francisco leads the year-over-year pack
The same calendar effect carried across the major markets, where most cities showed year-over-year declines on raw visits that turned positive once working days were accounted for. San Francisco led the year-over-year field, with per-working-day visits up 8.2 percent—tracking the city’s AI-driven leasing recovery. With its strongest leasing quarter this year since 2014, declining office availability, and robust net absorption, the city appears increasingly well-positioned to sustain its momentum.
Los Angeles followed at +6.5 percent year-over-year per working day, with Dallas, Chicago, Miami, New York, and Boston all in positive territory. Only three markets stayed slightly negative: Denver, down 1.4 percent from a year ago, Houston, down 0.6 percent, and Washington, D.C., essentially flat at -0.1 percent.
Denver’s continued softness likely reflects the same dynamics noted last month—a particularly remote-friendly labor market and record-high downtown vacancy. Still, improving net absorption and gradually strengthening demand for Class A office space may portend stronger visitation trends in the months ahead. Houston’s slight decline, meanwhile, may partly stem from contraction in its dominant energy sector, where major employers such as Chevron have reduced local headcount.
Miami still out front, Denver last
On the longer view versus 2019, the RTO rankings held their usual shape. Miami remained the clear leader, sitting 11.0 percent below its pre-pandemic baseline on a per-working-day basis, with New York next at 18.3 percent below. Denver finished last once more, down 48.4 percent from 2019. And San Francisco held onto third-to-last position, showing how far it has come from its former status as the nation’s weakest-performing office market.
For more data-driven RTO analyses, follow Placer.ai.
—Posted on June 30, 2026
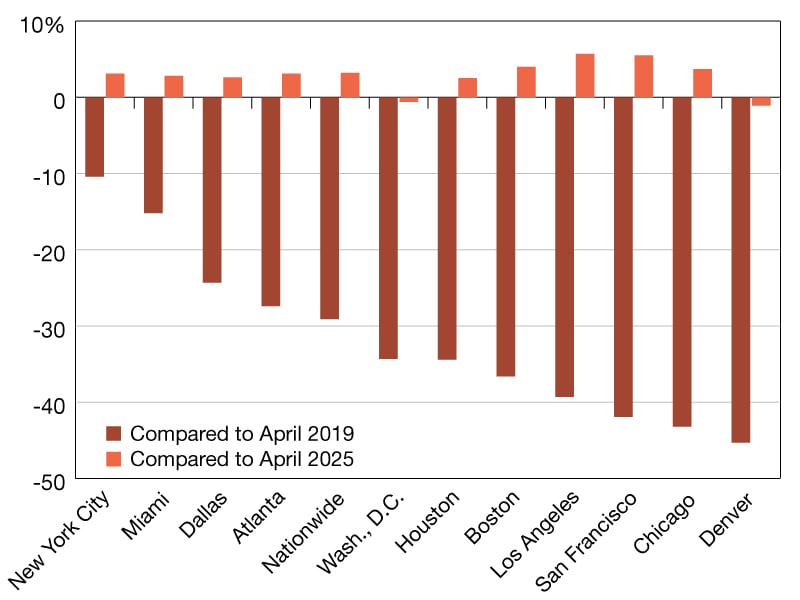
In April 2026, Home Depot’s five-day return-to-office mandate took effect for corporate employees—the latest addition to a growing list of major employers requiring more in-person presence. What does the latest data reveal about the pace of recovery on the ground?
A recovery pulled in two directions
Nationwide office visits landed 29.1 percent below April 2019 levels in April 2026—a slight improvement compared to April 2025. While this marks continued progress, the pace of recovery was more measured than in March, which saw a 4.2 percentage point gain when controlling for the number of working days. (April 2025 and April 2026 had the same number of working days, offering a clean basis for comparison).
Alongside the growing wave of mandates, a survey from MyPerfectResume early this year found that just 7 percent of employees would quit outright over a mandatory RTO policy in 2026—down from 51 percent in January 2025. The shift reflects a labor market that has continued to soften, leaving workers with less leverage to push back on policies they might have resisted just a year ago.
On the other side of the ledger, rising gas prices introduced a meaningful counterweight in April, with the national average surpassing $4.00 per gallon for the first time since 2022. For daily commuters already reassessing the cost of in-office work, a jump of more than $1.00 per gallon in a single month is a significant headwind—and likely one factor behind the slower pace of gains.
Regional roundup
Looking across eleven major office markets, nearly all posted modest year-over-year visit growth, led again by West Coast hubs Los Angeles and San Francisco. Once viewed as a persistent laggard, San Francisco’s AI-powered recovery has helped it avoid the bottom spot for several months running. And as the city’s narrative continues shifting from “doom loop” to “boom loop,” it is likely to keep gaining ground in the months ahead.
Denver, on the other hand, finished last in April across both measures—down 45.3 percent versus April 2019 and 1.1 percent from a year ago. With one of the most remote-friendly labor markets in the country and downtown office vacancy still hovering around 38 percent, the city is increasingly leaning on alternative strategies such as office-to-residential conversions to revive its urban core. Still, prime and Class A buildings remain a bright spot, as employers look to draw workers back with higher-quality spaces and perks rather than mandates alone—and as these efforts gain traction, Denver could begin to narrow the gap.
—Posted on May 27, 2026

After a weather-disrupted start to the year, March delivered a clear signal that the office recovery is once again moving forward. The latest data points to a seasonal rebound alongside tightening workplace policies translating into sustained return-to-office (RTO) gains.
A spring rebound
March 2026 marked the busiest March for office visits since the onset of COVID, with traffic just 26.5 percent below 2019 levels.
Part of this strength was calendar-driven, as the month included 22 working days compared to 21 in both 2019 and 2025. But even after adjusting for this difference, the underlying trend remained firmly positive. Average visits per working day were 29.8 percent below 2019 levels and 6.4 percent higher than March 2025, pointing to real and continuing momentum in the market.
Regional laggards closing the gap
On a regional basis, substantive year-over-year (YoY) gains were seen across every major market but Washington, D.C., where adjusting for working days revealed a 3.4 percent YoY visit gap – possibly influenced by a mid-month severe storm event that may have kept some workers home in a region relatively unaccustomed to such disruptions.
READ ALSO: AI Is Likely to Challenge Office Sector for the Rest of the Decade
Miami and New York remained at the top of the recovery curve, with office visits exceeding 90 percent of pre-COVID baselines.
But the more interesting story is unfolding on the West Coast, where some of the nation’s biggest recovery laggards are making steady progress. Los Angeles recorded the strongest YoY growth of any analyzed market, supported in part by the comparison to early 2025, when the city was still reeling from January’s wildfires. San Francisco, where an AI-driven recovery remains in full swing, also continued to build momentum, with visits up 15.4 percent YoY. The city is steadily climbing the post-pandemic recovery rankings—after avoiding the bottom spot since September 2025, it edged up to third from last for the second month in a row.
For more data-driven RTO analyses, follow Placer.ai/anchor.
—Posted on April 27, 2026
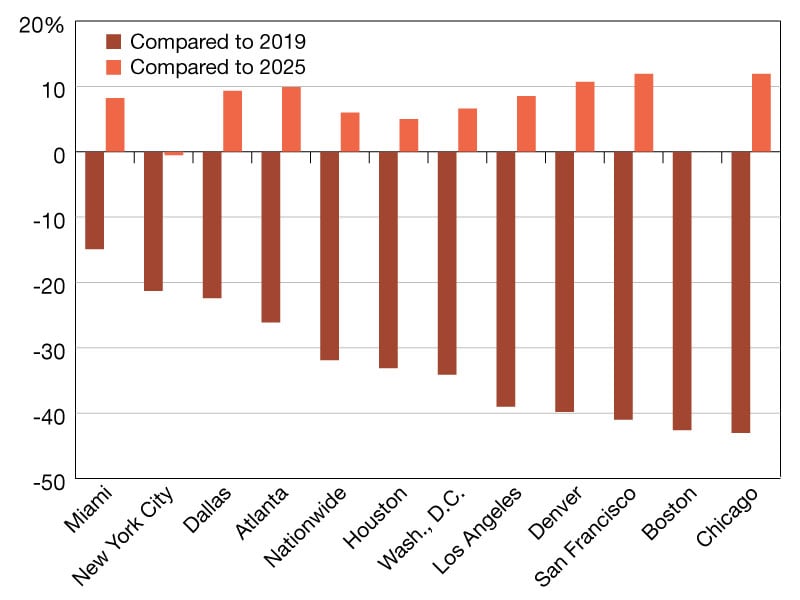
February 2026 marked the strongest in-office February since COVID-19, with the post-pandemic visit gap narrowing to 31.9 percent below 2019 levels.
In February 2026, visits to the Placer.ai Nationwide Office Index were 31.9 percent below 2019 levels—marking the smallest February post-pandemic visit gap to date. Overall attendance even slightly outpaced February 2024, a leap year that benefited from 20 business days instead of the usual 19.
Snowstorms skew the Northeast
While this is hardly the most impressive RTO showing we’ve seen in recent months, February’s gains came in spite of meaningful headwinds.
A late-February blizzard disrupted major Northeast markets, driving a year-over-year decline in New York City office visits and widening Manhattan’s post-pandemic gap to 21.3 percent below 2019 levels. Boston, also hit hard by snow, saw visits remain flat YoY, slipping behind San Francisco and Denver in overall recovery progress.
By contrast, cities in other regions posted clear gains, with San Francisco—still benefiting from AI-driven hiring and renewed tech activity—once again seeing some of the strongest growth at +11.9 percent year-over-year.
For more data-driven office insights, follow Placer.ai.
—Posted on March 27, 2026
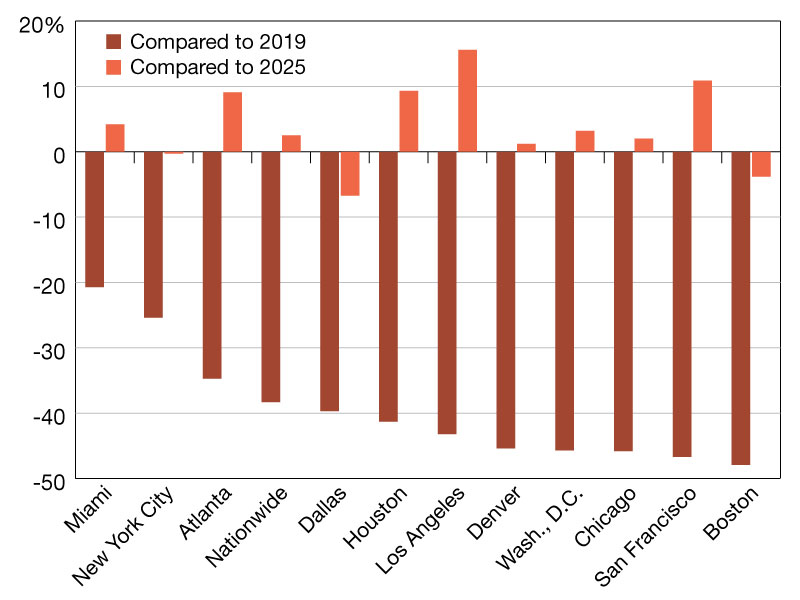
January 2026 delivered a reminder that return-to-office progress is anything but linear—but it is still gaining ground. Despite Winter Storm Fern disrupting travel and commutes across large parts of the country toward the end of the month, office attendance continued its gradual recovery. Visits to the Nationwide Office Index were 38.3 percent below January 2019 levels, a modest improvement from January 2025, when a Polar Vortex similarly inhibited commutes.
And while total monthly visits came in slightly below January 2024 levels, adjusting for the number of working days reveals a more encouraging picture. On a per-working-day basis, January 2026 was the busiest in-office January since COVID-19—no small feat in a month when ice and snow covered large swaths of the contiguous U.S. for several days. The fact that offices were generally fuller than in prior Januaries, even amid widespread disruptions, points to a robust underlying return-to-office trajectory.
Cities tell a weather-driven story
Fern’s influence becomes clearer, however, when zooming in on individual metros. Cities that avoided the worst of the storm generally posted stronger year-over-year gains, while heavily impacted markets saw flatter or negative results. Miami, for example, continued to record year-over-year increases, while New York City—hit hard by Fern—saw visits edge down 0.3 percent year-over-year.
READ ALSO: Top 10 Markets for Office Deliveries in 2025
Last year’s winter conditions also played a meaningful role in annual comparisons. Both Dallas and Houston were affected by Fern this January, though Dallas bore the brunt of the storm, with snow, ice, travel disruptions, and flight cancellations contributing to a 6.7 percent year-over-year drop in office visits. Houston, by contrast, experienced more limited disruption in January 2026 and posted an annual increase—in part because it was lapping the January 2025 Gulf Coast Blizzard, which saw rare snow accumulations effectively shut the city down. In other words, Houston’s biggest weather-related disruption occurred last winter, while Dallas faced a more acute shock this year.
Washington, D.C.’s 3.2 percent year-over-year uptick and Atlanta’s 9.1 percent gain similarly reflect comparisons to January 2025, when both markets were hampered by extreme winter weather. But these rebounds also point to underlying recovery momentum—especially for Atlanta, which, despite being impacted by Fern, ranked third among the analyzed cities for post-pandemic office recovery.
Meanwhile, West Coast markets that were largely spared severe winter conditions posted the strongest year-over-year gains. Los Angeles and San Francisco led the pack, with annual increases of 15.6 percent and 10.9 percent, respectively.
For more data-driven office insights, follow Placer.ai/anchor.
—Posted on Feb. 27, 2026
You must be logged in to post a comment.