Global

U.S. Quarterly Property Index
Most returns have softened since 2015 but the industrial sector has proved more resilient.

Global Annual Property Index
Currency movements can have a big impact on performance as this chart demonstrates.

Annual vs. Five-Year Total Return
Judged on their 2017 total return and five-year annualized performance, the world’s major cities do not stand out, for all their popularity with offshore investors.

Total Return Performance
This chart compares the 2017 total return performance of the 25 national markets in MSCI’s IPD Global Annual Property Index.

Total Return Performance Momentum
In 2017, the picture is very different with most markets reporting higher total returns compared to the prior year. The positive momentum has been most pronounced in European markets like the UK, Hungary, the Czech Republic and Germany.

Industrial Total Returns
Country-wide, industrial total return in 2017 was 12.1 percent and has benefited from strong demand for last mile logistics assets.

Total Return Performance of Retail vs. Non-Retail Assets
The “retail apocalypse” reflects fears that consumers are abandoning bricks-and-mortar stores in favor of online shopping, potentially spelling disaster for retail malls and shopping centers.

Performance Cycle Across International Markets
Retailer bankruptcies, department store struggles and empty malls have dominated recent headlines.
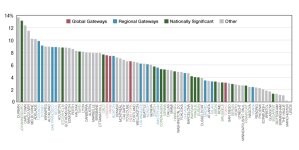
Total Return Ranking
Over the 10 years to December 2016, global gateways were not standout performers but generally offered lower income returns in exchange for higher capital growth.

Higher-Value Assets Outperform Others in Same Country
Using MSCI global real estate dataset, we find evidence that higher-value assets have been more likely to outperform other assets in the same country and sector than lower-priced assets.