


Global (Research Center)
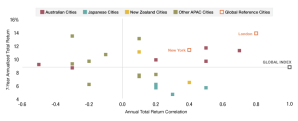
Annual vs. Seven-Year Total Return
Over the seven year period, most APAC cities have outperformed the global index.
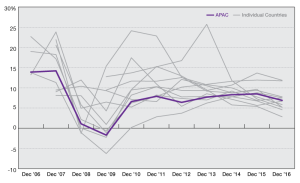
Asia Pacific vs. Other Global Markets
The Asia Pacific region has some of the most diverse real estate markets in the world. Alongside more established markets like Australia and Japan, there are a number of more nascent markets with lower transparency, higher barriers to entry and at various stages of development.
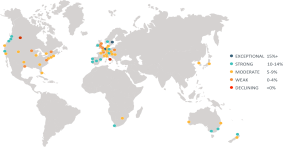
Direct Private Real Estate Returns
In 2016, direct private real estate returned 7.4 percent but across major metropolitan markets there was considerable variation due to differences in local market conditions.
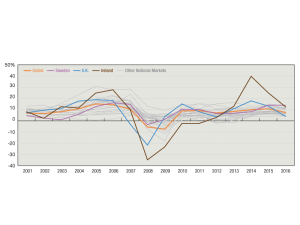
Direct Private Real Estate Returns
In the earlier part of the decade, the UK market had been one of the strongest performers but in a precipitous decline aided by the Brexit referendum result, the country recorded the lowest total return in the Global index at 3.9 percent in 2016.
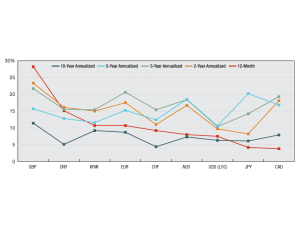
Currency Return
For U.K. based investors, the depreciation of the pound makes unhedged U.S. performance look rather attractive. For Canadian or Japanese investors by contrast, the picture changes depending on the return horizon.
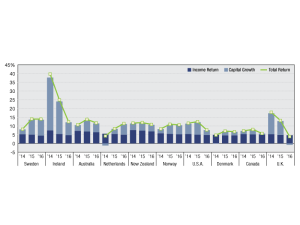
Income Return vs. Capital Growth
Total returns in Northern European countries—such as Sweden, Norway and Denmark—increased in 2015 but then decreased in 2016.
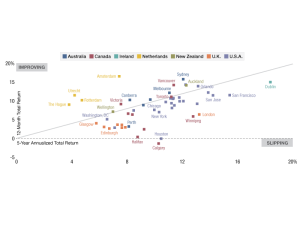
Globalized Total Return
Comparable annualized total return as at end of September 2016
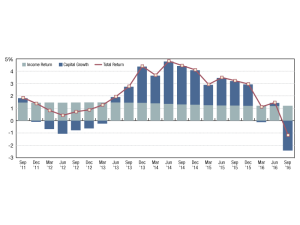
The Brexit Effect
Brexit effect in the third quarter with a -2.4% capital growth contraction
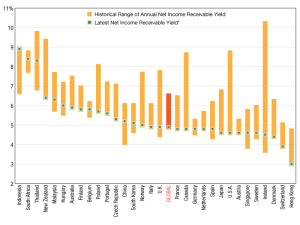
Net Income Receivable Relative to Local Market
Annual net income receivable yield by country, all property types, standing investments, as of September 2016
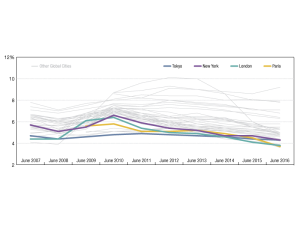
Global Real Estate Income Returns
All property income returns in local currency as of June 2016