

Finance (Research Center)
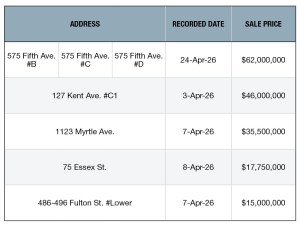
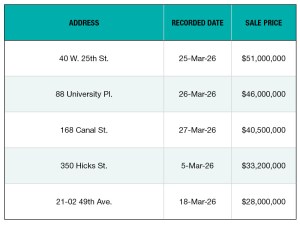
Top 5 NYC Retail Building Sales—April 2026
These are the largest retail transactions in New York City, collected monthly by PropertyShark.
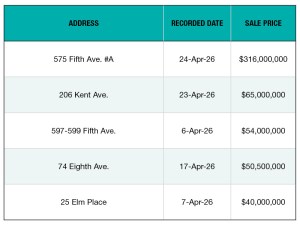
Top 5 NYC Office Building Sales—April 2026
PropertyShark collected the largest office transactions in New York City.
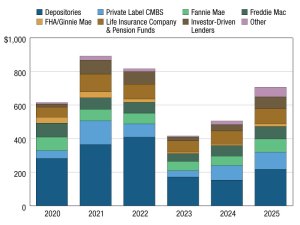
Commercial Real Estate Lending, Borrowing Jumped 40% in 2025
MBA’s analysis shows a “meaningful rebound” as capital markets stabilized.
Top 5 NYC Retail Building Sales—March 2026
A roundup of the largest retail transactions in New York City, rounded up monthly by PropertyShark.
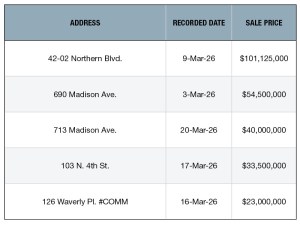
Top 5 NYC Office Building Sales—March 2026
Here are New York City’s largest office transactions, rounded up monthly by PropertyShark.
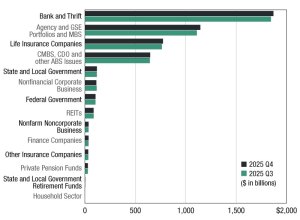
Commercial and Multifamily Mortgage Debt Outstanding Increased to $5T in Q4
The increase also marked a 4.5 percent jump year-over-year.
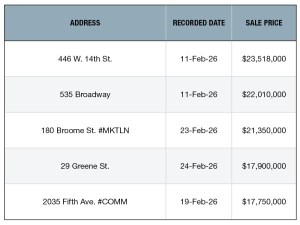
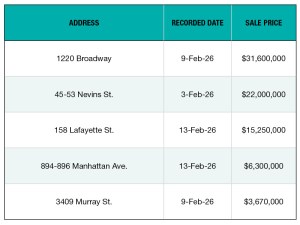
Top 5 NYC Retail Building Sales—February 2026
A list of New York City’s top deals for the retail sector, based on PropertyShark data.
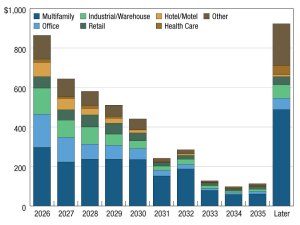
17 Percent of Commercial Mortgage Balances to Mature in 2026
Trends point to a forecast of stronger years ahead for originations.
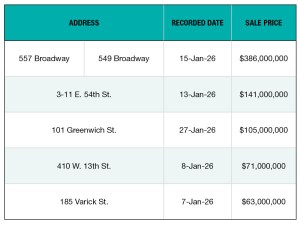
Top 5 NYC Office Building Sales—February 2026
These are the top five deals for the office sector in New York City, based on PropertyShark data.
Top 5 NYC Office Building Sales—January 2026
A list of New York City’s largest office transactions, collected monthly by PropertyShark.