

Research Center
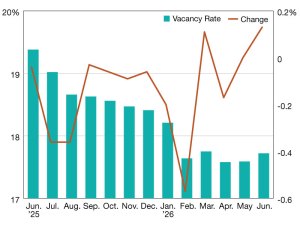
2026 Office Vacancy Update
The latest data shows a significant year-over-year improvement, according to Yardi Matrix.
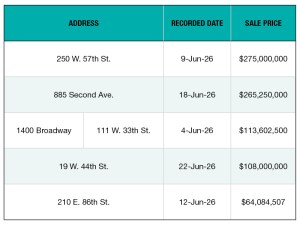
Top 5 NYC Office Building Sales—June 2026
The five largest transactions in New York City include the $275 million sale of 250 W. 57th St.
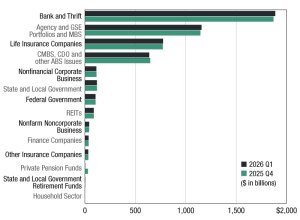
Commercial and Multifamily Mortgage Debt Outstanding Crossed $5T in Q1
The milestone reflects the resiliency and depth of commercial markets.

Top 5 Midwestern Metros for Office Deliveries
These markets saw almost 1.2 million square feet come online in the first five months of 2026, according to Yardi Matrix information.

Industrial Report: Trade Deal Delay Clouds Planning
A missed deadline could complicate strategy for industrial occupiers, investors and developers.

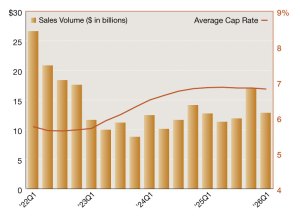
2026 Single-Tenant Net Lease Sales Volume & Cap Rates
Top trends impacting the market, according to Northmarq.
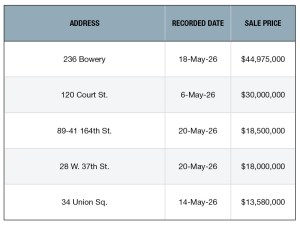
Top 5 NYC Retail Building Sales—May 2026
PropertyShark collected the largest retail transactions in New York City.
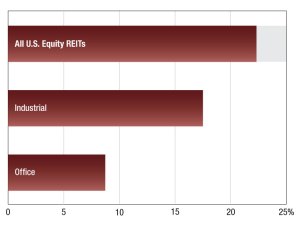
2026 Commercial REIT Values
S&P Global Intelligence’s latest snapshot of REIT performance. Read the report.
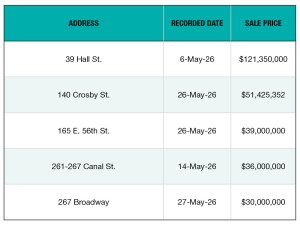
Top 5 NYC Office Building Sales—May 2026
These are the five largest transactions in New York City, collected monthly by PropertyShark.