Property Metrics
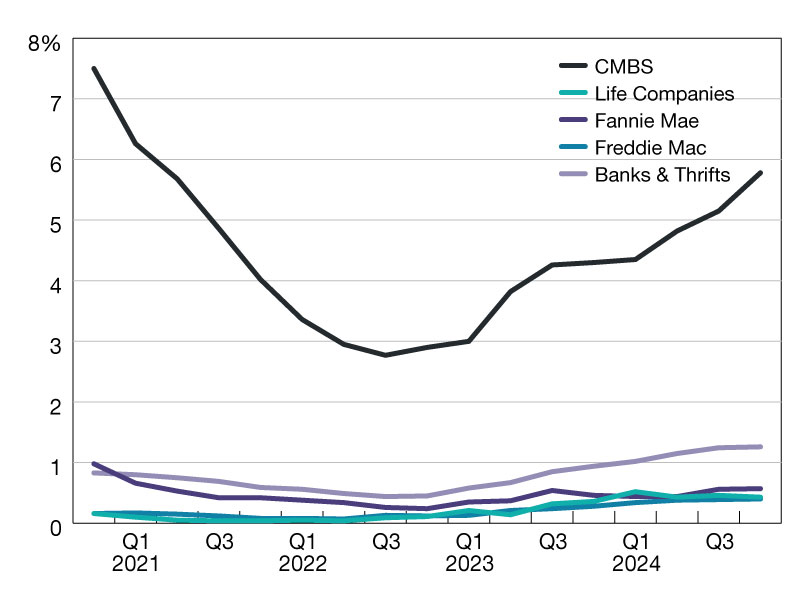
Mortgage Delinquency Rates Increased in Q4 2024
MBA estimates that almost $1 trillion’s worth of loans are maturing in 2025.
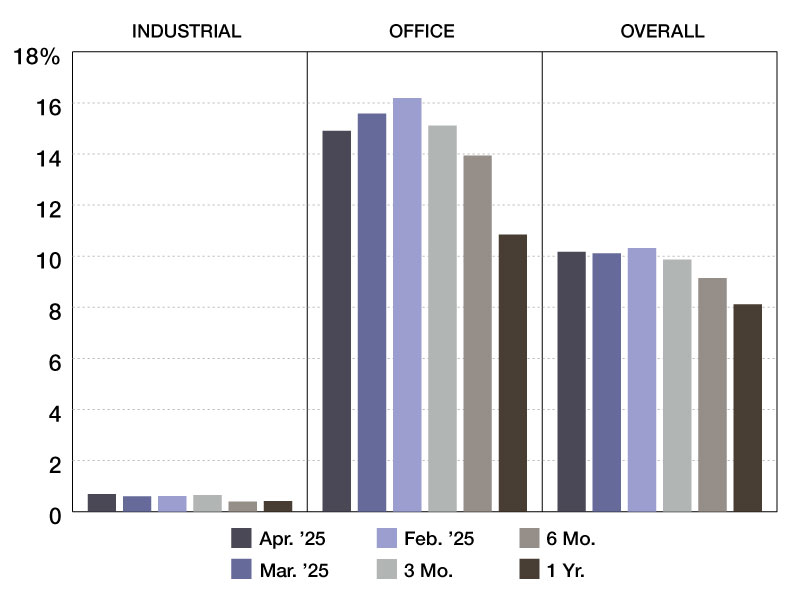
2025 Special Servicing Rates
Data from Trepp’s latest report.
Top 5 NYC Retail Building Sales—March 2025
The metro’s top deals for the sector rounded up by PropertyShark.
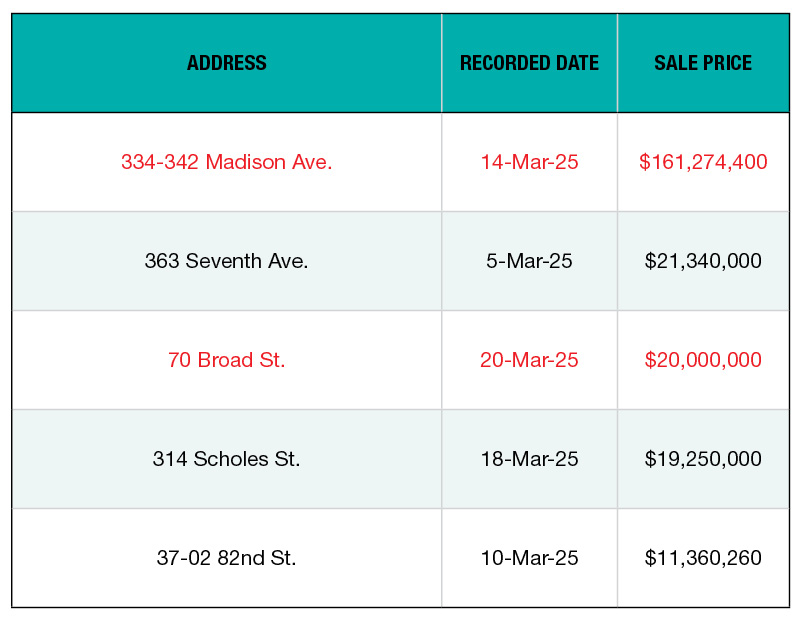
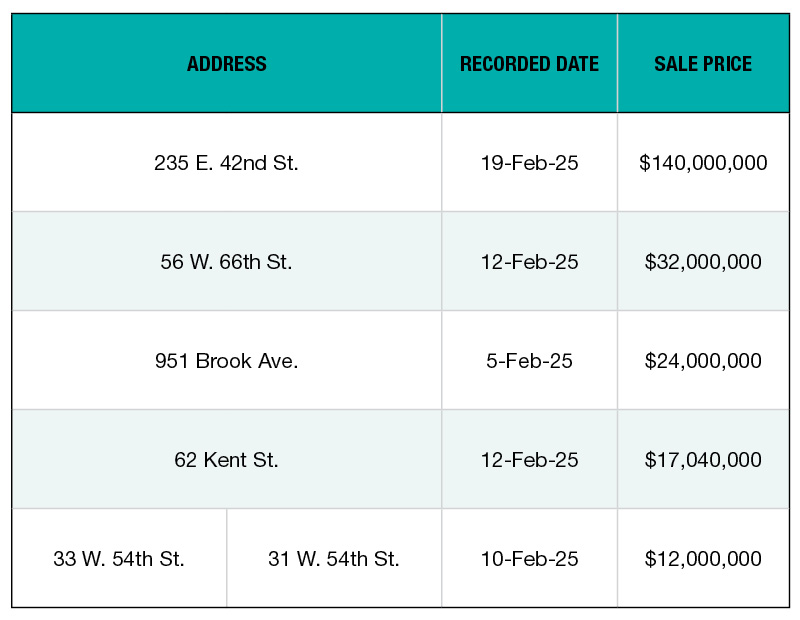
Top 5 NYC Office Building Sales—March 2025
Here are the metro’s largest transactions for the sector.
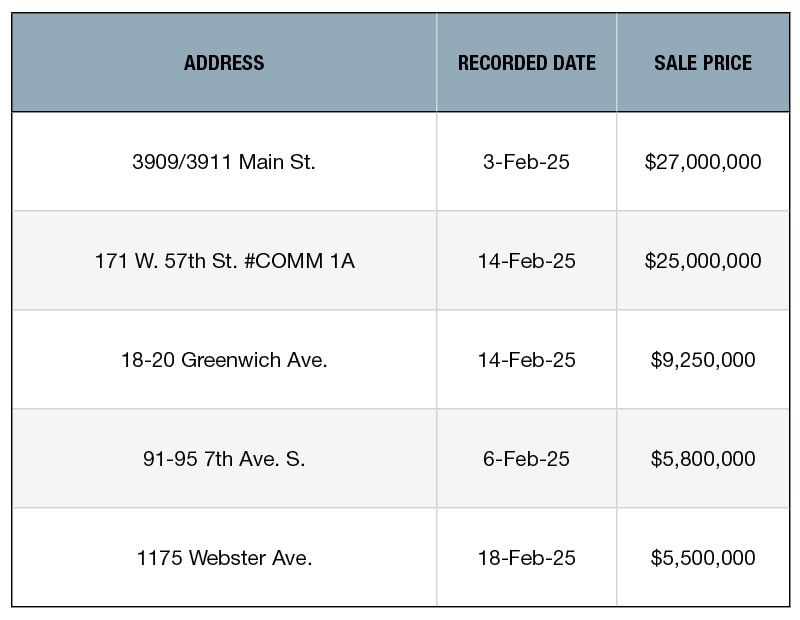
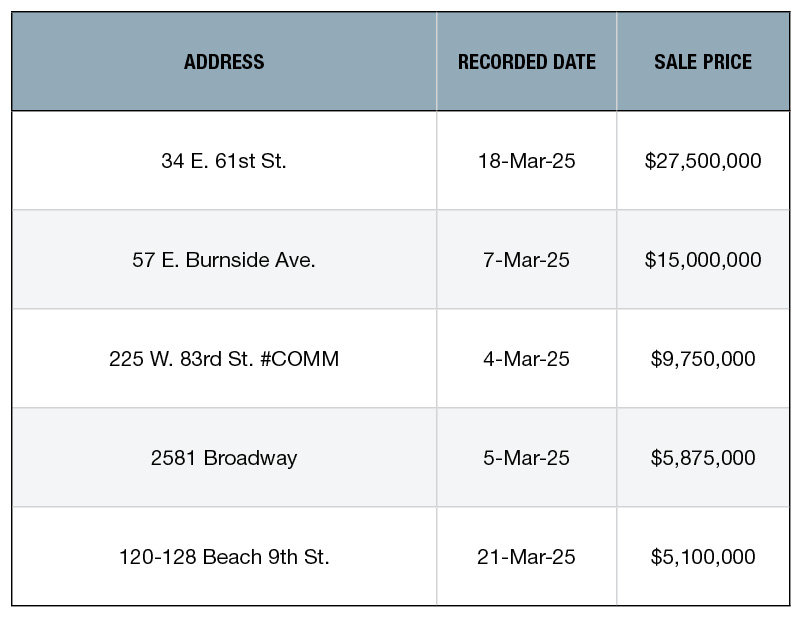
Top 5 NYC Retail Building Sales—February 2025
A recap of recent major transactions compiled by PropertyShark.
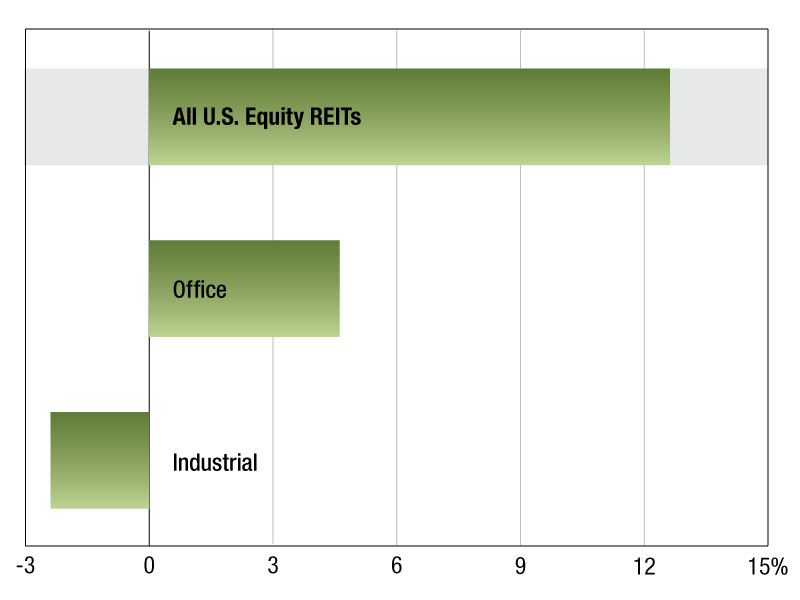
2025 REIT Returns
The Dow Jones Equity All REIT Index’s latest update on performance from S&P Global Market Intelligence.
Top 5 NYC Office Building Sales—February 2025
A recap of recent major transactions compiled by PropertyShark.
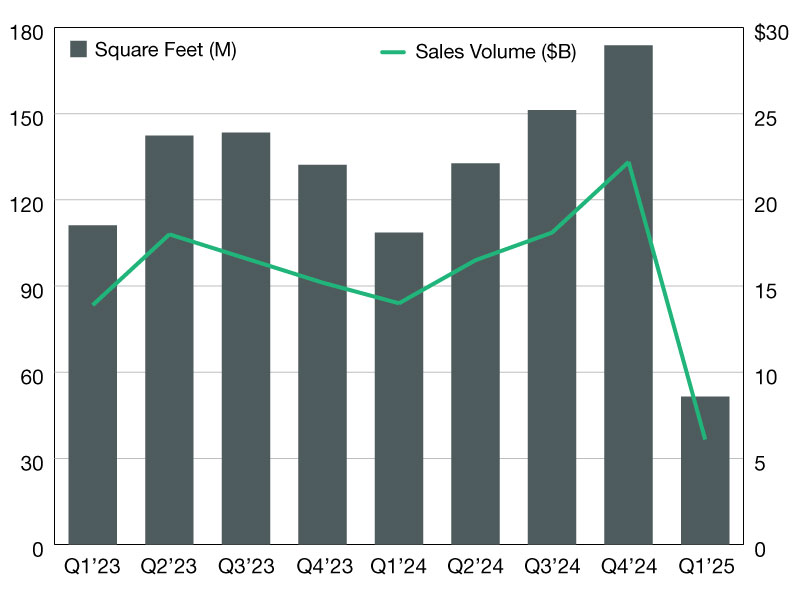
2025 Industrial Sales Update
Industrial deals totaled more than $70 billion in 2024, CommercialEdge data shows.
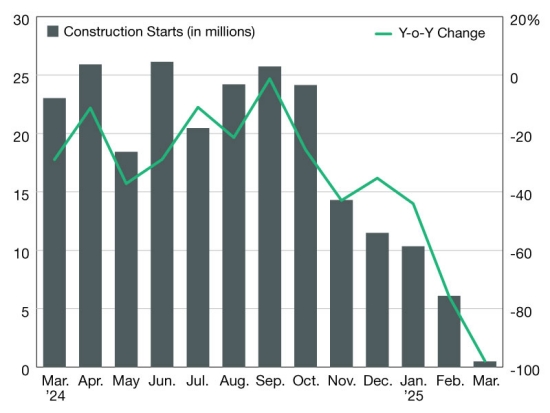
2025 Industrial Pipeline Update
Groundbreakings declined sharply this year, compared to the same period in 2024, according to CommercialEdge data.