Property Metrics

Global Trade Rebalancing
How are the U.S. capital markets tackling tariffs?
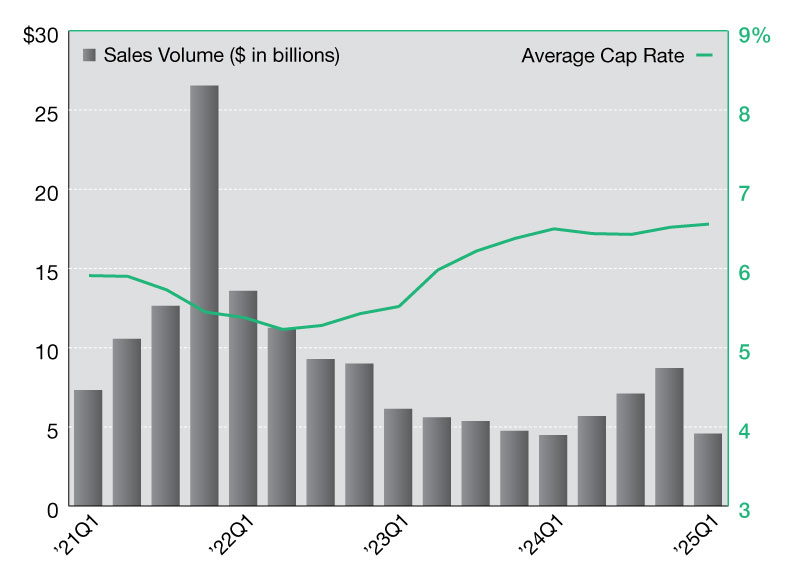
2025 Industrial Net Lease Sales Volumes and Cap Rates
Industrial net lease sales and cap rates in the first quarter of 2025.
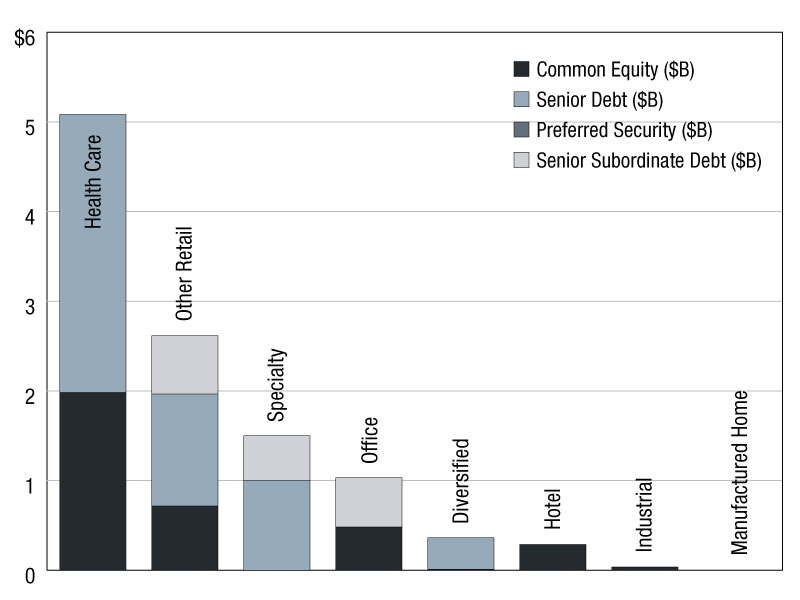
2025 REIT Offerings
The latest REIT capital-raising figures from S&P. Read the report.
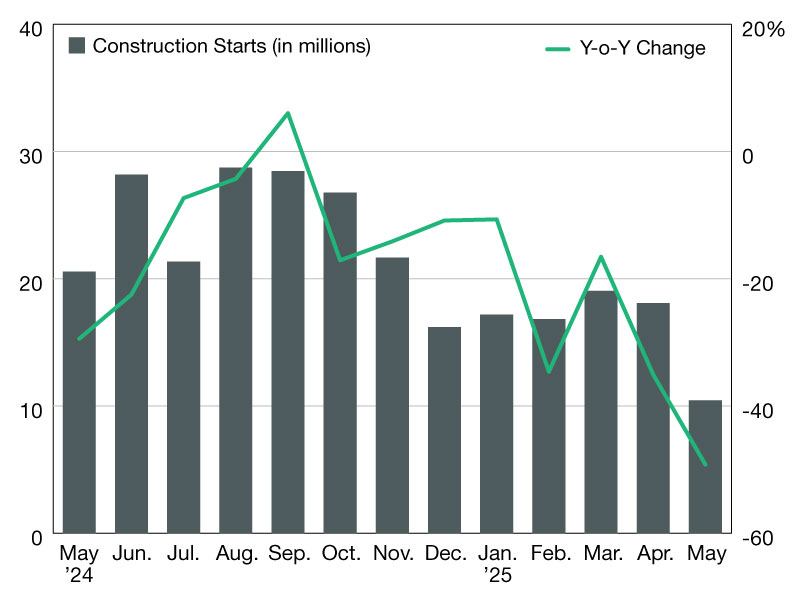
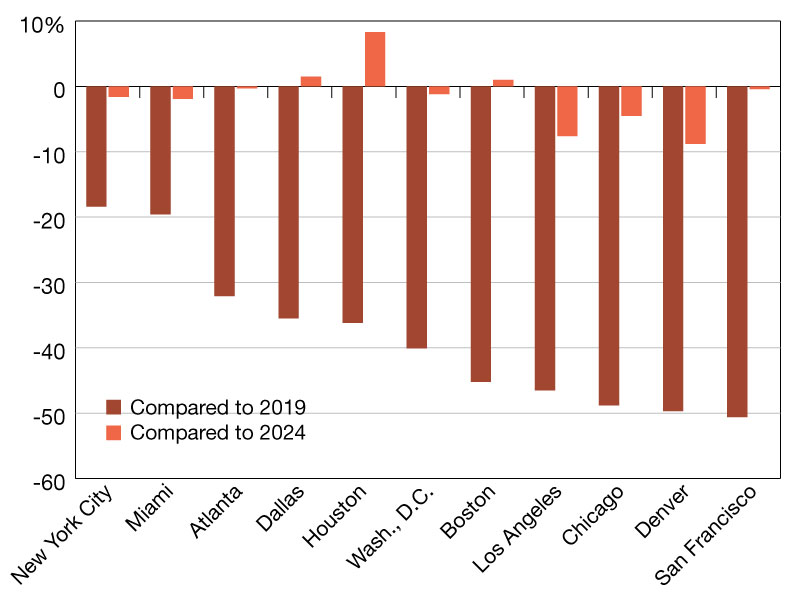
Industrial Construction Starts Plunge in 2025
Groundbreakings declined sharply this year, compared to the same period in 2024, according to CommercialEdge data.
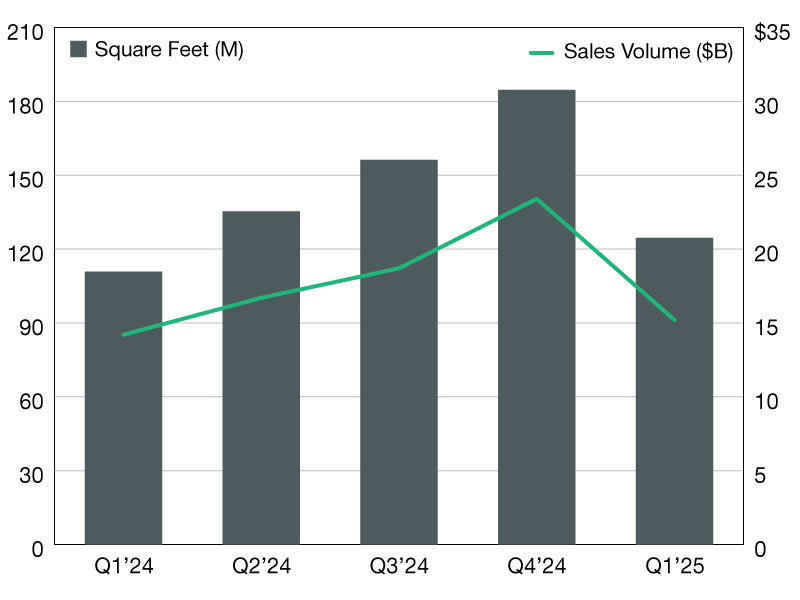
2025 Industrial Sales Update
Industrial deals totaled more than $70 billion in 2024, CommercialEdge data shows.
2025 Placer.ai Office Index
See the evolution of office foot traffic patterns on a nationwide and regional level.

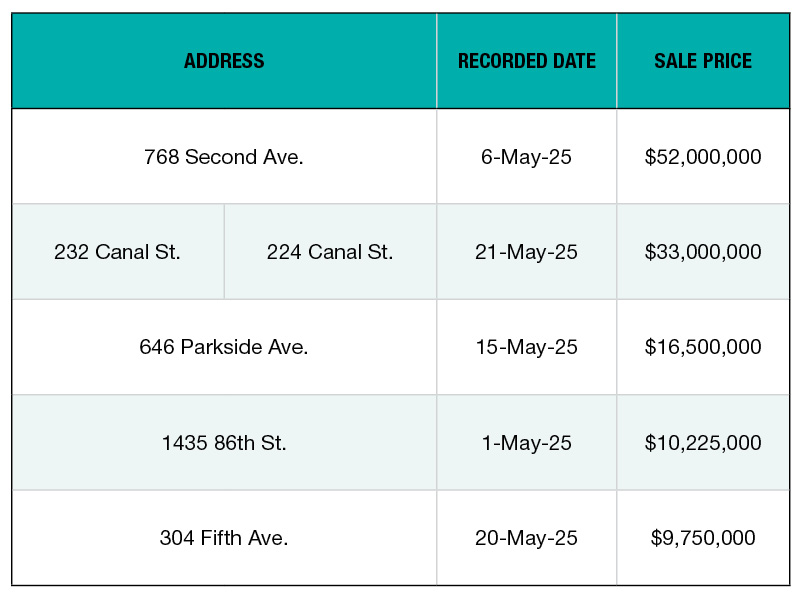
Top 5 NYC Retail Building Sales—May 2025
The metro’s top deals for the sector rounded up by PropertyShark.
Top 5 NYC Office Building Sales—May 2025
The metro’s top deals for the sector rounded up by PropertyShark.
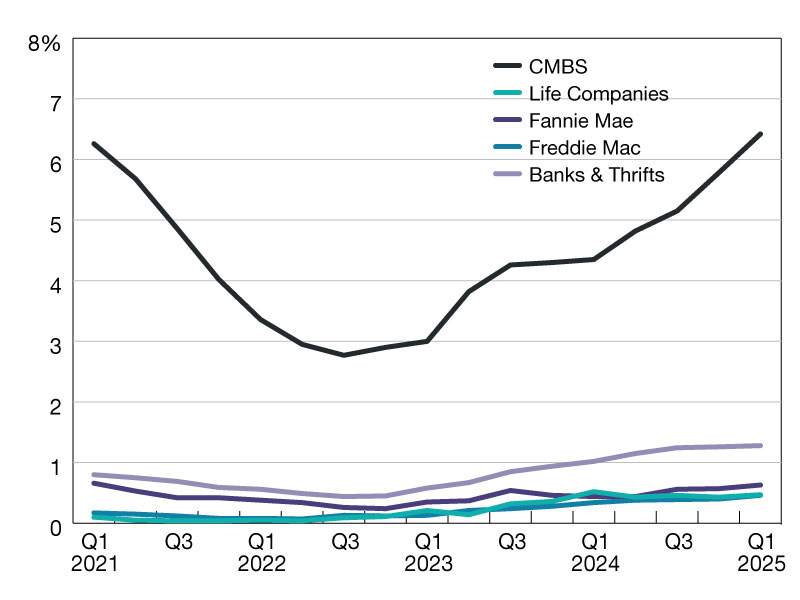
Commercial and Multifamily Mortgage Delinquency Rates Increased in Q1 2025
The uptick in CMBS delinquencies signals stress in some market areas, according to MBA research.