

Life Science Construction Falls, Deals Rebound
Development and new starts are declining, mirroring national office trends as the sector adjusts.

Development continues to decline in the life science sector, following years of rapid expansion, while new supply has yet to be absorbed, according to the latest Yardi Matrix national office report.
Developers have completed 47.3 million square feet of life science space since 2020. Annual deliveries have peaked in 2024 at 13.9 million square feet before slowing to 11.2 million square feet in 2025. Life science completions are expected to fall again in 2026, as only 11.3 million square feet were under construction as of February.
Construction starts have also declined. The peak for life science starts was in 2022, when 15.4 million square feet broke ground, while 2025 ended with only 2.4 million square feet in new space.
Developers continued to concentrate new supply in the three primary life science hubs. San Francisco led 2025’s life science completions with 3.3 million square feet (28.9 percent of total deliveries). Boston had 2.3 million square feet (20.3 percent) and San Diego’s (12.8 percent) consisted of 1.5 million square feet.
READ ALSO: Why Life Science Space Faces a Slower 2026
Investor interest for life science assets showed modest improvement last year. The sector had 37 transactions totaling $1.7 billion, with assets selling at $324 per square foot. This represents a renewed interest from the 14 sales that closed in 2024, when dollar volume totaled $600 million and average prices were 23.9 percent higher, at $426 per square foot.
The national office vacancy rate stood at 17.6 percent as of February—down 200 basis points from a year ago. The vacancy recovery is scattered nationwide, with only eight of the top 25 U.S. office metros with rates above 20 percent.
Denver recorded the steepest year-over-year improvement at -520 basis points. Other markets that followed include the Bay Area (-420 basis points), Houston (-390 basis points) and San Francisco (-360 basis points). Miami’s 12.8 percent vacancy rate stood out as the lowest in the country, followed by Manhattan’s (13.1 percent).
Asking rents averaged $32.79 per square foot in February—24 cents up from the previous month and 1.9 percent lower year-over-year. The leading metro for office rents remained Manhattan, where listing rates reached $73.45 per square foot, followed by San Francisco ($62.54 per square foot).
Construction pullback continues, pricing resets
Construction activity remained at a historical low as office starts slowed over the past two years. The national office development pipeline comprised 28.2 million square feet in February, representing 0.4 percent of the existing stock. Office completions so far included 2.3 million square feet.
The leading metro for development was still Boston, where 3.9 million square feet were underway in February. Markets that followed include Manhattan (2.8 million square feet) and Dallas (2.4 million square feet). On the other hand, Seattle had the smallest pipeline nationally, at 19,982 square feet.
Back in 2019, there were 20 markets with at least 1 million square feet breaking ground, a figure that fell to only three markets in 2025. Manhattan had 2.3 million square feet starting construction last year, followed by West Palm Beach (1.4 million square feet) and Boston (1.2 million square feet).
The U.S. office sector saw 316 transactions close as of February, properties selling at $218 per square foot on average for a total $7.8 billion. Manhattan remained the top metro for office sales, with investors generating $1.6 billion and properties selling at $740 per square foot. However, sales activity for San Francisco office space pushed prices at $1,088 per square foot in February.
In 2026, Miami is on track to have the highest quarterly sales volume since 2020. As of February, Miami’s investment volume reached $666 million—third-highest nationwide. The metro maintained its property values through Covid, with 2025 office prices recording a 20 percent increase from 2019, averaging $356 per square foot.
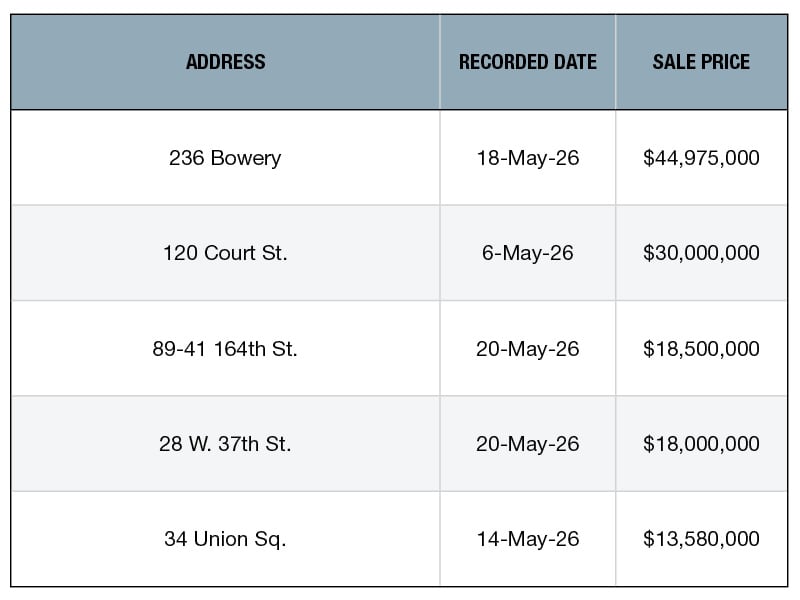
In February, Miami properties sold at $475 per square foot. In January, Goldman Properties and Citadel’s Founder & CEO paid $180 million for a 324,935-square-foot office building in Miami.
Read the full Yardi Matrix office report.

You must be logged in to post a comment.