

San Francisco Office Market Sees Elevated Pricing, Sluggish Sales
The latest Yardi Matrix data reveals this gateway market’s uneven fundamentals.
The San Francisco office sector entered 2026 with uneven fundamentals, according to Yardi Matrix data.
The metro’s construction activity remained limited, with one of the smallest office pipelines nationwide.
Investment volume continued to cool off to one of the lowest levels in the country, while pricing surged, topping the charts in February. Vacancy remained elevated—though showing a notable recovery from a year ago. Another bright spot is the metro’s coworking activity, which held steady in a shifting office landscape.
As of February, San Francisco’s office sector had 1.4 million square feet of overall space underway across seven projects. This accounted for 0.7 percent of existing inventory—on par with the national average.
The metro’s pipeline placed it sixth among gateway markets. Boston led with 5.1 million square feet, followed by Manhattan (3.1 million square feet) and Los Angeles (2.7 million square feet).
Shrinking San Francisco office pipeline reflects national pace
As for the competitive office space, San Francisco’s construction activity included only 533,315 square feet, representing 0.3 percent of inventory—one of the smallest pipelines among the top 25 office markets, placing 13th.
Boston led with 3.9 million square feet, followed by Manhattan’s 2.8 million square feet. In contrast, the smallest pipeline in the U.S. was in Seattle, where only 19,982 square feet were underway.
Construction pace so far in 2026 remains low, mirroring national office real estate trends. Only 28.3 million square feet were underway in February across the U.S, with only seven of the top 25 office markets recording pipelines above the 1 million-square-foot mark.
San Francisco emerged as the leading market for office deliveries in 2025. The wave of completions stemmed from its previous construction surge driven by the life sciences sector. Since many of these were large, long-running projects, San Francisco’s office sector is expected to experience a sharp pullback in development.
However, despite the slower development activity, San Francisco’s planned or proposed projects accounted for 2.6 percent of its inventory.
READ ALSO: Office Fit-Out Costs Are Rising—Here’s Why
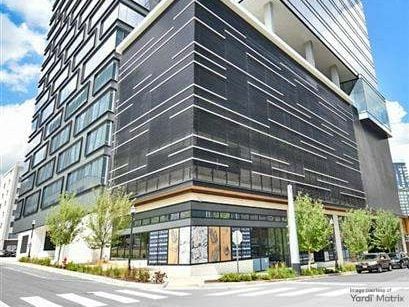
The metro’s top five largest office projects total a combined 1.2 million square feet. Potrero Power Station’s Block 2 remains the largest development at 278,230 square feet. Associate Capital broke ground in August 2025 on the project, that represents the centerpiece of a $2 billion redevelopment dubbed Dogpatch Power Station. It will replace the former PG&E power plant with 1.6 million square feet of office and research labs, 110,000 square feet of retail and 2,601 homes.
The second-largest project in San Francisco is the upcoming office component within YouTube’s headquarters. Totaling 248,000 square feet at 1300 Bayhill Drive in San Bruno, Calif., the building is part of the first phase of YouTube’s redevelopment. The company first unveiled plans for its project in 2021, when the city approved a 20-year endeavor with plans calling for 2.4 million square feet of new space.
San Francisco flex office space holds steady amid market shifts
As of February, San Francisco’s coworking inventory totaled 3.9 million square feet across 151 locations, according to CoworkingCafe. This represented 2.2 percent of the metro’s total leasable office inventory—slightly below the 2.3 percent national average and on par with Boston’s and Seattle’s figures.
Across gateway markets, Manhattan had the largest coworking hub at 12.5 million square feet, followed by Chicago (9.1 million square feet) and Los Angeles (7.6 million square feet).
San Francisco’s list of top five largest flex office providers remained unchanged since our previous coverage. WeWork kept the largest footprint at 736,795 square feet, followed by Regus (391,981 square feet), Studio by Tishman Speyer (256,759 square feet), Spaces (220,880 square feet) and MBC BioLabs (206,454 square feet).
Weak deal volume meets record prices
San Francisco’s office investment continued the slower pace from 2025, with $50 million in total dollar volume at the end of February.
The amount ranked it 21st among the top 25 markets and as the only gateway market with deals below the $100 million mark. Only Portland, Ore. ($32 million), Austin ($17 million) and Nashville ($8 million) recorded lower sales volumes than San Francisco.
In contrast, Manhattan topped the charts with $1.6 billion in sales as of February. Other gateways that followed included Miami ($666 million), Chicago ($309 million) and Washington, D.C. ($290 million).
However, despite lower investment pace, San Francisco office‘s average prices reached $1,088 per square foot in February. The figure topped the charts and outperformed Manhattan prices, where properties sold at $740 per square foot.
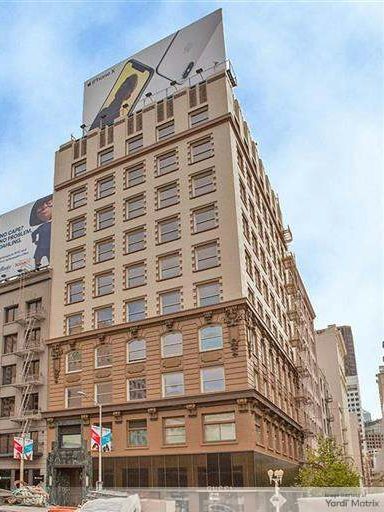
One of the biggest sales recorded since the start of 2026 is the $44 million transaction involving 240 Stockton St. Moran Capital purchased the 40,442-square-foot building in the city’s North Financial District from Grosvernor. The property traded at a 45 percent lower price compared to its previous sale from 2016, Yardi Matrix data shows.
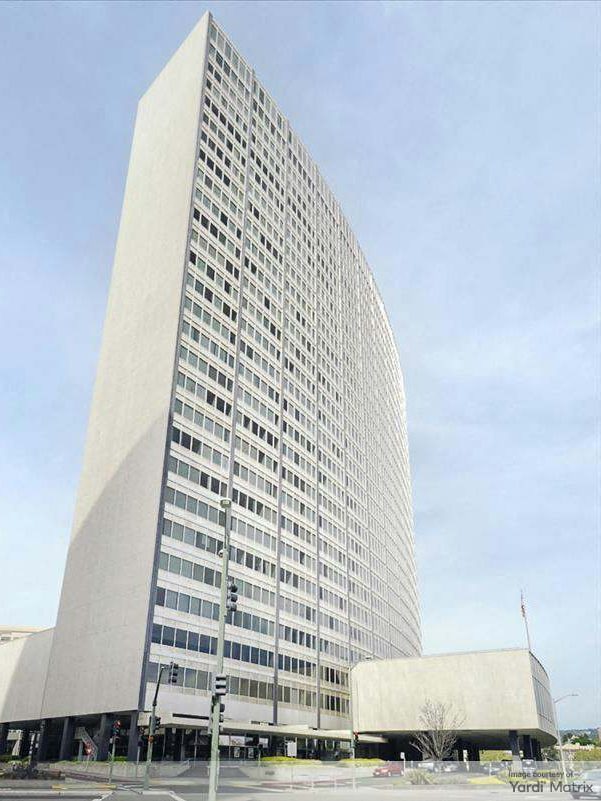
The slower investment pace seems to mirror the metro’s 2025 performance. San Francisco saw almost $1.5 billion in deals last year, with properties trading at $286 per square foot on average. One of the largest deals from 2025 was the acquisition of 300 Lakeside Drive in downtown Oakland, Calif. Pacific Gas and Electric Co. completed the purchase in three tranches totaling $906 million.
High vacancy persists, rents remain premium
As of February, San Francisco’s office vacancy rate reached 24.2 percent—above the national rate of 17.6 percent and recording a 360-basis-point year-over-year decline. Office vacancy recovery continues to improve nationwide, with only eight of the top 25 U.S. markets posting rates above 20 percent in February.
San Francisco’s average vacancy rate was the second-highest nationwide, after Austin’s 24.6 percent. In contrast, Manhattan and Miami posted the lowest vacancies in the country, at 13.1 percent and 12.8 percent, respectively.
Asking rents averaged $62.54 per square foot in San Francisco—above the $32.79 national average. The metro maintained its second place among the most expensive office markets, while Manhattan remained the top metro, with rents reaching $73.45 per square foot.


You must be logged in to post a comment.