

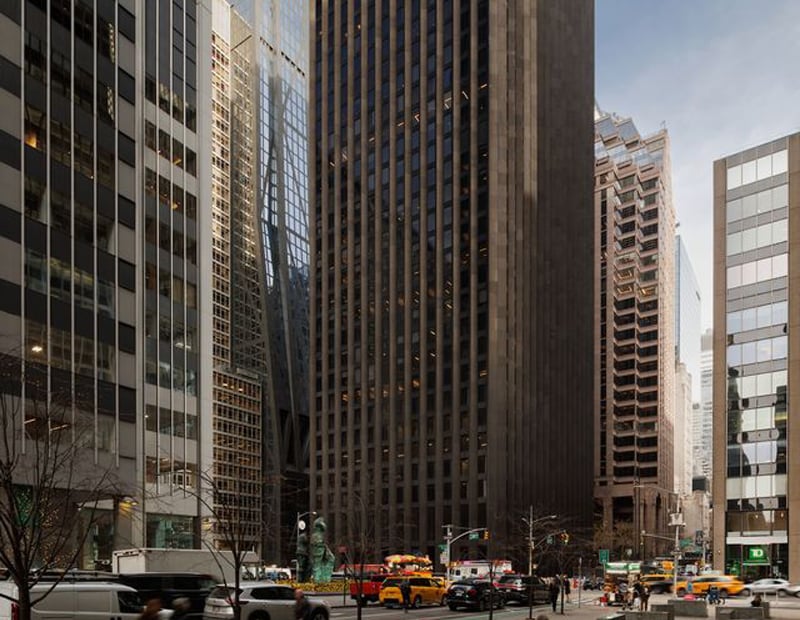
Industrial Demand Turns the Corner in Q1
A Savills report predicts stronger demand for the rest of the year, but energy is a wild card.
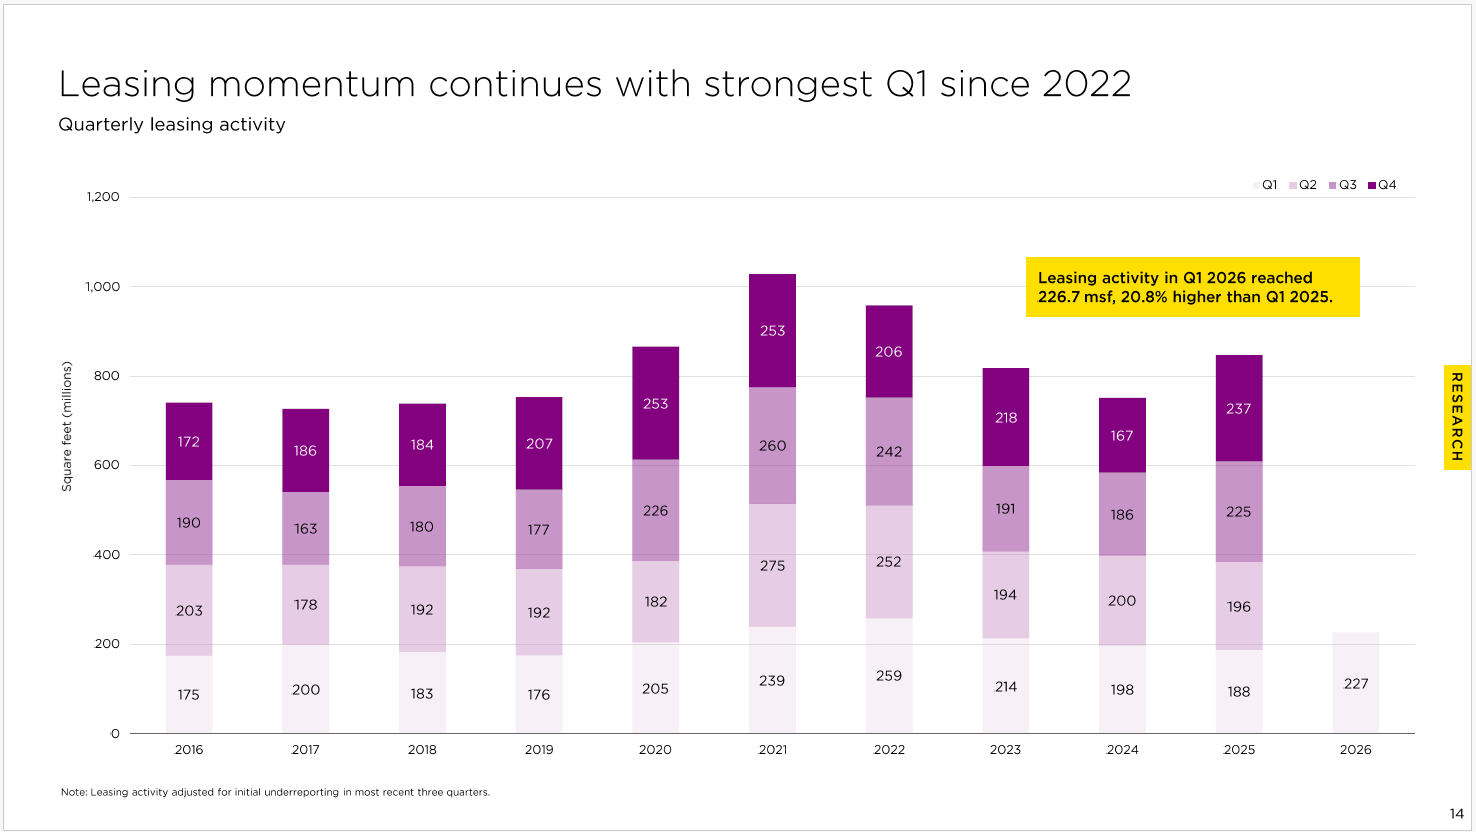
Demand for U.S. industrial space grew during the first quarter of 2026, with leasing in the sector totaling 226.7 million square feet, according to a Savills report, marking the strongest first quarter since 2022 and an increase of 20.8 percent year-over-year. Other metrics, including lower vacancies in some markets and a reduction of sublease space overall, are positive as well.
Yet the spike in energy costs, driven by high oil prices as a result of the war in Iran, represents a headwind for future demand, the report notes. Energy cost risk has historically been correlated with softer demand for industrial space.
LISTEN TO: Investment Matters – Institutional Eye
“The strength of demand for industrial property so far in 2026 is especially notable given the backdrop of a continued challenging macro environment including higher oil prices,” Savills Vice President & Head of Industrial Research Mark Russo told Commercial Property Executive.
“However,” Russo added, “there’s also a lot of nuance in the leasing market right now with landlords and tenants in strikingly different negotiating positions depending on portfolio composition, region and space size, to name a few factors.”
Industrial metrics Improve, but headwinds remain
Demand for industrial space has grown recently, representing an uptick from previous sluggishness, but vacancy rates remain about the same, Savills notes. Considering the surge in development spurred by pandemic-era demand, the uptick in demand hasn’t yet translated into lower vacancy rates or increased absorption.
In the first quarter of 2026, nationwide vacancy stood at 8.2 percent, unchanged from the previous quarter and up from 7.8 percent during the first quarter of 2025. Absorption is still positive, with tenants more interested in larger blocks of space than before, the report says.
Savills predicts that vacancy will decline over the next 12 months, as industrial completions decrease and net absorption increases. In the first quarter of 2025, some 98.1 million square feet of industrial space came online, while in the first quarter of 2026, only 63 million square feet did. Moreover, total space under construction in 2026’s first quarter was 273.7 million square feet, down from 305.9 million square feet a year earlier.
On the other hand, oil shocks are associated with less industrial demand, and uncertainty about the course of the war and its aftermath is spurring a shock of unknown duration and severity.
Peak demand for industrial space, Savills explained, coincided with relatively low oil prices, especially from 2015 to 2021. Now that oil prices have risen again, that’s a headwind for industrial demand.
Industrial’s structural tailwinds
Oil might be a wild card, but there are other forces at work that constitute tailwinds for industrial demand, the report notes. After a slowdown in ecommerce penetration in the retail market, for instance, the growth of ecommerce penetration is under way again.
In the first quarter, ecommerce accounted for 16.6 percent of total U.S. retail sales, up 110 basis points from two years ago. In 2025, the size of Amazon’s U.S. facilities topped 500 million square feet for the first time. For a sense of scale, the entire metro Chicago industrial market is roughly 1 billion square feet.
Additionally, investment in U.S. manufacturing has started growing again, a trend that will add to the demand equation for industrial if it continues, though a certain amount of that will be build-to-suit. In February 2026, investors put $60 billion into manufacturing, more than double the figure recorded in the same month in 2025, according to the report.
Sun Belt still on top
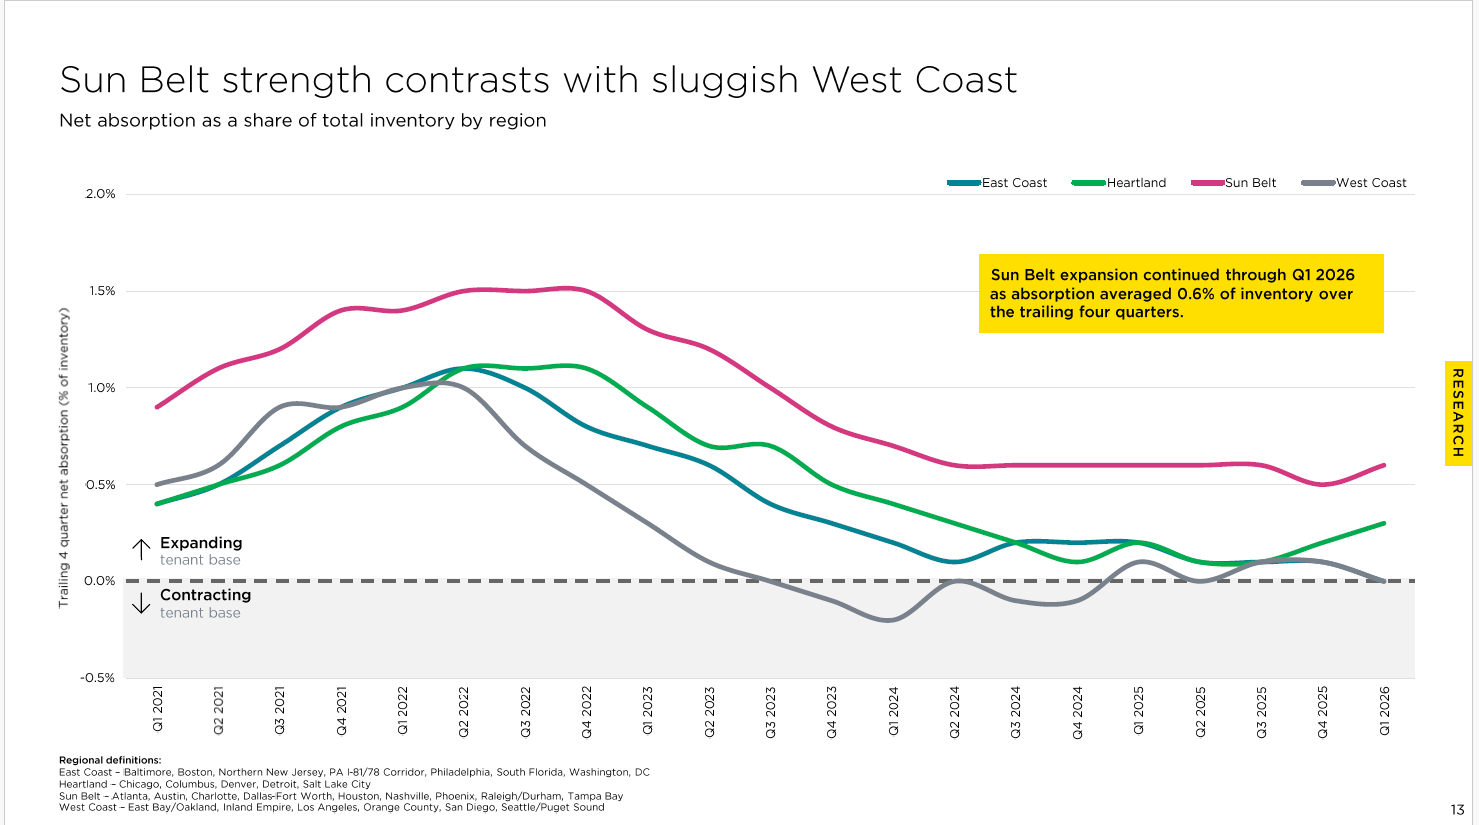
Different industrial markets are exhibiting different levels of strength, according to Savills.
Sun Belt markets, including Atlanta, Austin, Dallas-Fort Worth, Houston, Nashville, Phoenix and others, experienced industrial absorption equal to about 0.6 percent of their inventory in the first quarter, more than twice as much as Midwestern markets such as Chicago, Columbus and Detroit, along with Denver and Salt Lake City. Both East and West Coast markets saw little absorption for the quarter.
However, even the Sun Belt figure is down from the boom days of 2022, when absorption touched 1.5 percent of inventory in that region. The rest of the country saw absorption at about 1 percent of inventory for a short time during the heady immediate post-pandemic days.
The Sun Belt markets are still developing more industrial space than elsewhere, with Houston topping the list nationally at 22.9 million square feet under construction in the first quarter of 2026. Dallas-Fort Worth and Atlanta were second and third nationally by that metric, with 18.8 million square feet and 17.7 million square feet underway, respectively.
You must be logged in to post a comment.