


Miami Office Market Maintains Strong Fundamentals
Here's how low vacancy and a substantial development pipeline set Miami apart from other major office markets.
Miami’s office market remained among the nation’s strongest, maintaining solid fundamentals despite the broader sector slowdown, according to Yardi Matrix data. The Magic City recorded one of the lowest vacancy rates in the country, helping the market maintain its resilience amid nationwide occupancy challenges.
Investment activity improved, although Miami continued to trail several peer markets. Construction activity also remained elevated compared to other gateway cities, with the metro among just six of the top 25 U.S. office markets with pipelines exceeding 1 million square feet.
As of August, Miami had 2.9 million square feet of office space under construction across 15 projects, ranking fourth nationally behind Manhattan (5.7 million square feet), Dallas (3.5 million square feet) and Boston (3.3 million square feet). The pipeline represented 3.5 percent of the metro’s existing office stock, the highest share among the markets surveyed.
Miami leads in office pipeline share
As for competitive office space, Miami had 2.2 million square feet under construction as of August, accounting for 3 percent of its existing inventory—well above the 0.5 percent national average and the highest share among the top 25 U.S. office markets.
Miami’s competitive construction activity once again ranked fourth nationwide, following the same metros: Manhattan (3.8 million square feet), Boston (3.6 million square feet) and Dallas (3 million square feet). Seattle had the lowest pipeline nationwide at just 15,910 square feet.
Additionally, when looking at planned or proposed projects, Miami’s figure rose to 7.1 percent of its inventory—still well above the 1.7 percent national average and leading all markets.
The five largest office projects totaled 1.9 million square feet as of August. One of them is Santander Tower in the city’s Brickell district, expected to come online in 2029.
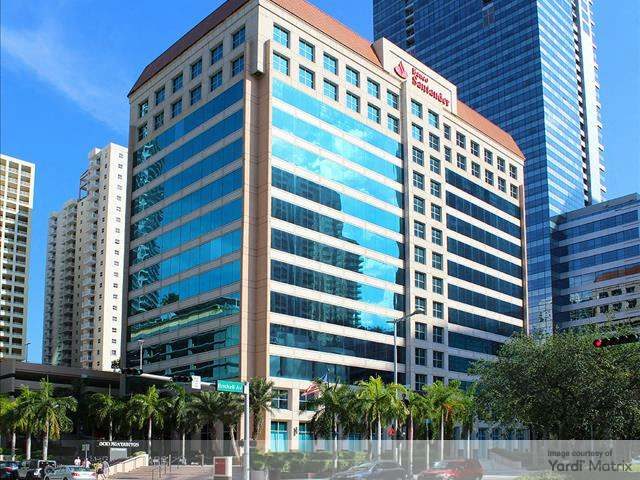
Santander Bank first unveiled plans for its development in the summer of 2024, later demolishing its entire 14-story location at 1401 Brickell Ave. In April this year, the bank broke ground on its 50-story tower at that address, set to total 1.6 million square feet of mixed-use space, out of which 877,276 square feet are designed for office use. The project reflects more than 40 years of Santander operations in Miami and Florida.
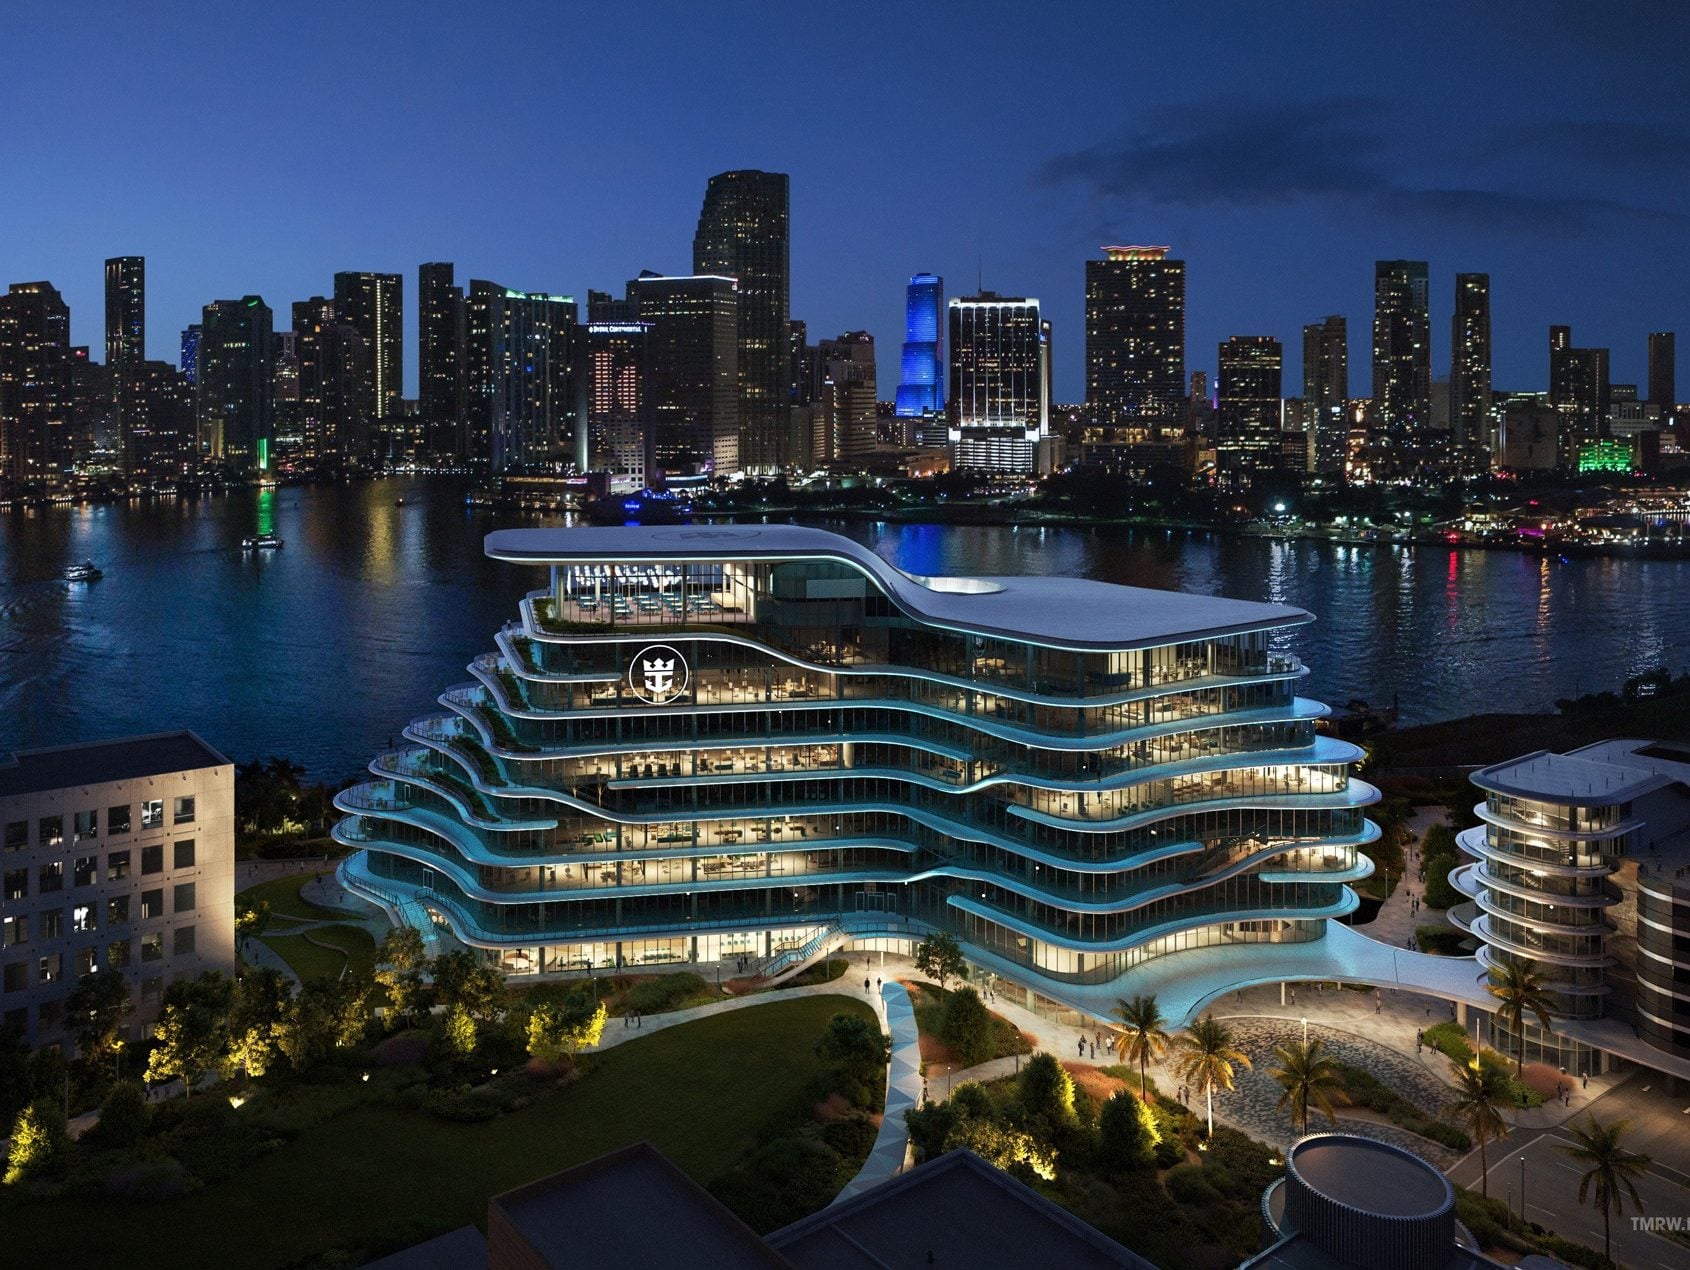
Royal Caribbean’s new headquarters, totaling 495,000 square feet, is the second-largest project in the city and has been underway since 2024. HOK topped out on the property in June this year, while the completion date has been pushed for year-end.
Three projects broke ground during the first eight months of 2026, totaling 241,296 square feet, or 0.3 percent of the metro’s inventory. Meanwhile, developers completed 455,202 square feet of office space across four properties. This represented 0.6 percent of Miami’s office stock and marks a 59 percent year-over-year increase in office deliveries.
Miami maintains low office vacancy
Miami’s office vacancy rate fell to 11.6 percent at the end of August—below the 17.8 percent national average and down 170 basis points year-over-year. The metro had the second-lowest rate in the country, after Manhattan’s 10.2 percent.
Several metros recorded notable vacancy improvements. However, eight of the top 25 U.S. office metros still posted rates above the 20 percent mark. Gateway cities with high vacancies included San Francisco (25.9 percent) and Seattle (24.7 percent).
The Magic City’s average listing rates reached $59.73 per square foot—significantly above the $33.30 per square foot national average. Miami’s rents were the third most expensive among the top-performing metros. Manhattan held the leading spot, with rents averaging $72.70 per square foot, followed by San Francisco’s $65.41 per square foot.
In contrast, gateway cities with more affordable rents included Chicago ($28.38 per square foot) and Seattle ($35.17 per square foot).
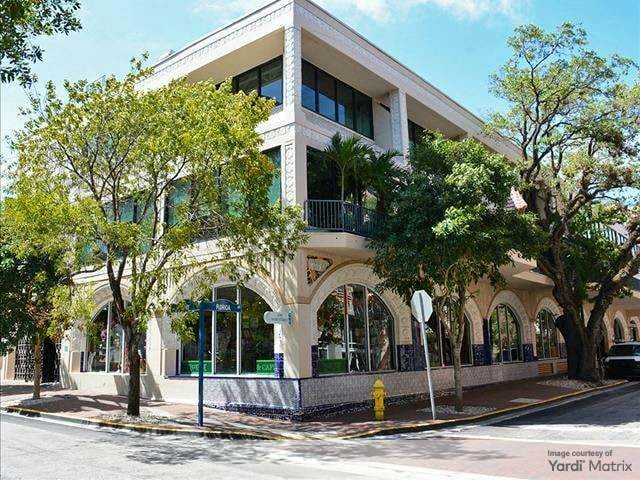
One of Miami’s notable office leases this year was IT and security firm Iru’s 92,000-square-foot commitment at Mayfair in the Grove in Coconut Grove. The company signed the agreement in April. Whalou Properties owns the three-building, 279,550-square-foot office and retail complex.
Investment gains momentum, pricing remains high
Miami’s office investment volume reached $1.1 billion year-to-date through August, ranking 11th nationally and second-to-last among gateway markets. However, stronger transaction activity in recent months and an improvement from the Magic City’s 2025 performance suggest that the metro could see further gains before year-end.
In terms of transaction volume, Manhattan remained the nation’s leader with $5.2 billion in sales. Gateway cities that followed included San Francisco ($2.8 billion), Washington, D.C. ($2.4 billion) and Los Angeles ($1.7 billion), among others. Seattle remained at the lower end of the list, with only $426.1 million in deals.
Meanwhile, Miami’s pricing ranked higher, placing it fourth among the top 25 U.S. office markets. As of August, properties sold for $406 per square foot on average—more than double the $205 national figure.
Among gateway markets, Manhattan ($600 per square foot) and San Francisco ($536 per square foot) recorded higher average sale prices than Miami, while Seattle ($306 per square foot) and Los Angeles ($233 per square foot) trailed. Chicago remained the lowest-priced gateway market, with assets trading at an average of $88 per square foot.
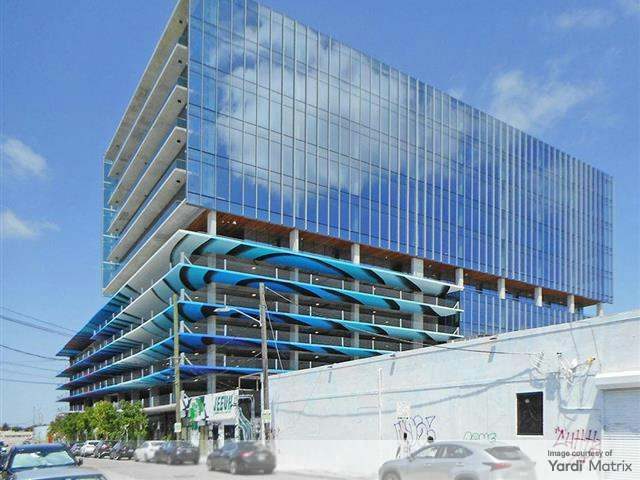
Miami’s largest office transaction by dollar amount remained the acquisition of 545 Wyn by Goldman Properties and Citadel’s Founder & CEO Ken Griffin. The partnership paid $180 million for the 324,935-square-foot creative office asset in January.
Miami leads in flex space share
Miami’s coworking inventory reached 3.4 million square feet across 163 locations in August, according to CoworkingCafe. Despite its expansion, the metro maintained the smallest flex office footprint among gateway markets. Manhattan led with 12.5 million square feet, followed by Chicago (9.3 million square feet) and Los Angeles (7.6 million square feet).
The metro’s coworking square footage accounted for 4.7 percent of its leasable office inventory, well above the 2.4 percent national average and the highest among all markets. Notable values were also recorded in Chicago, at 2.9 percent, as well as in Manhattan and Los Angeles, both at 2.6 percent.
The top five flex office providers by footprint remained unchanged. Regus led with 339,045 square feet, followed by Spaces (301,630 square feet), WeWork (268,578 square feet), Industrious (262,000 square feet) and Quest Workspaces (221,749 square feet).
Other operators are also expanding in the metro. In August, Venture X added a 20,000-square-foot location in Pompano Beach, Fla. The company’s new coworking space will be operated by Priddy Spaces and is set to open at Grover Corlew’s Mayla Pompano, a recently renovated office building.




You must be logged in to post a comment.