

Industrial Pricing on the Rise, Dollar Volume Follows
Investors closed 522 sales totaling $9 billion in the first two months of the year, Yardi Matrix shows.
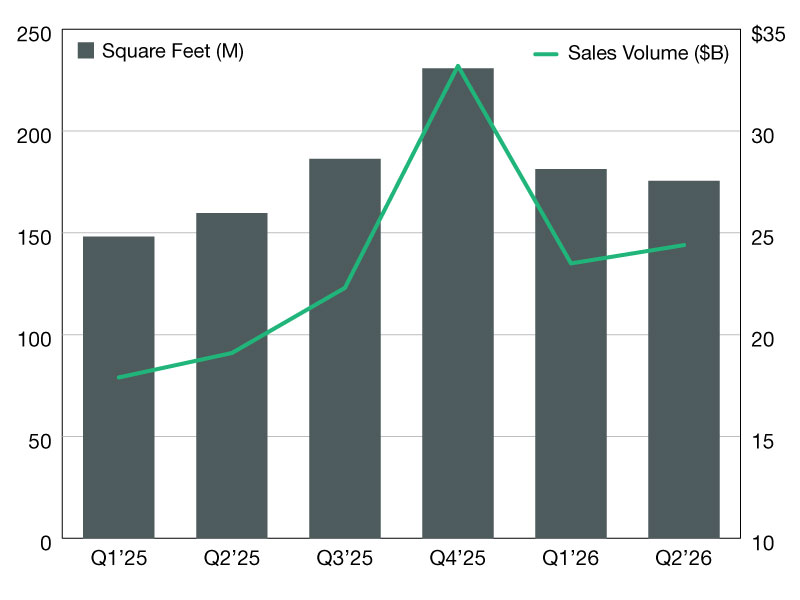
Year-to-date through August, investors closed 3,572 transactions involving 449.3 million square feet of industrial space and generating $60.5 billion in sales volume, according to the latest Yardi Matrix data. The average sale price reached $137.65 per square foot—4.5 percent higher than the year-end 2025 average of $131.76.
READ ALSO: How the Middle East Conflict Is Impacting CRE Investment
In July and August, 648 industrial transactions closed, involving 92.5 million square feet and $12.6 billion in sales volume. The total is 47.3 percent lower than in the second quarter, when transaction volume reached $24.4 billion. Additional deals could narrow the gap before quarter-end.
Industrial properties sold for an average of $139.54 per square foot during the first two months of the third quarter, down 1.1 percent from the second-quarter average of $141.09 per square foot. However, pricing remained nearly 5 percent above the first-quarter average of $133.12 per square foot.
Q2 industrial sales outperform year-ago levels
The second quarter of 2026 closed with 1,464 industrial sales, generating $24.4 billion in transaction volume. The amount marked a 27.7 percent year-over-year increase from the $19.1 billion recorded during the same period of 2025.
Pricing and total square footage sold were also higher than a year earlier. Industrial properties traded for an average of $141.09 per square foot during the second quarter of 2026, up 14.7 percent from $123.04 per square foot in the same quarter of 2025. Total space sold reached 175.5 million square feet, nearly 10 percent more than the 159.7 million square feet that traded during the same period in 2025.
—Posted on September 25, 2026

Year-to-date through February, investors closed 522 transactions involving 63.6 million square feet of industrial space, generating just under $9 billion, according to the latest Yardi Matrix data.
The average sale price reached $143.89 per square foot during the first two months of 2026—a 19.7 percent jump from the $120.23 per square foot average from last year’s first quarter.
READ ALSO: What Will Define Industrial’s Next Stage of Growth?
The last quarter of 2025 closed with less space selling for higher prices. At the end of 2025’s fourth quarter, a total of 1,584 industrial transactions closed. These involved 198 million square feet, selling for a total of $30.8 billion—nearly 50 percent more from the same quarter in 2024.
More specifically, at the end of 2024’s fourth quarter, investors sold 207.5 million square feet specifically across 1,667 sales, generating $26 billion.
Sales prices also increased in late 2025. The average sale price per square foot stood at $164.70 in late 2025—30.5 percent above the $126.19 average registered during 2024’s last quarter.
Stronger performance in 2025
There were 5,544 industrial sales in 2025, encompassing 673.8 million square feet and totaling $90.4 billion. Overall, 2025 ended with higher investor appetite—the total dollar amount recorded had a 18 percent increase from the $76.6 billion registered in 2024.
Last year, properties sold at $134.70 per square foot, with prices 11.3 percent higher from 2024, when industrial assets sold for $121.08 per square foot.
—Posted on March 26, 2026


You must be logged in to post a comment.