

Heightened Industrial Demand Boosts New Lease Rates
New leases signed in the last 12 months averaged $1.88 more than the average in-place rents, according to the latest CommercialEdge report.
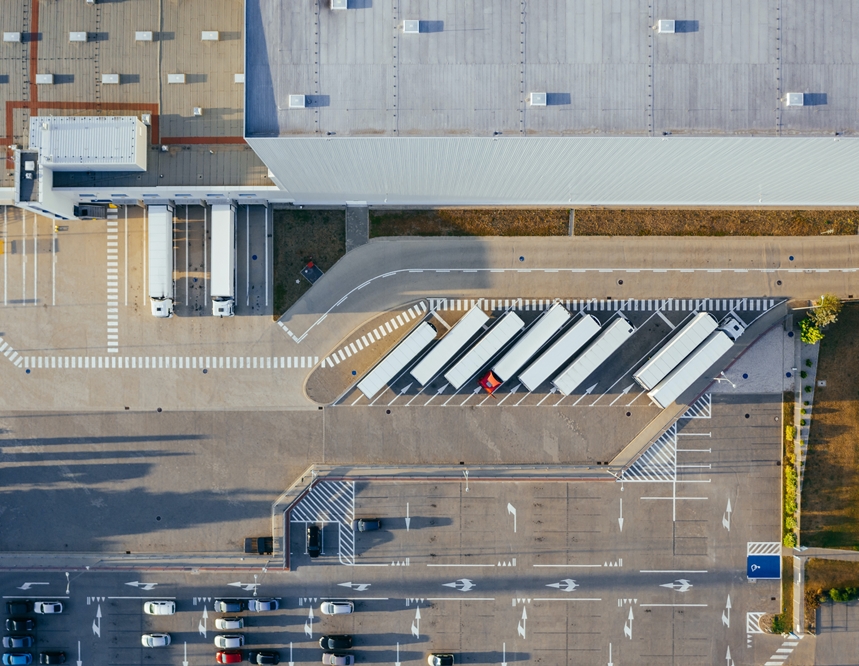
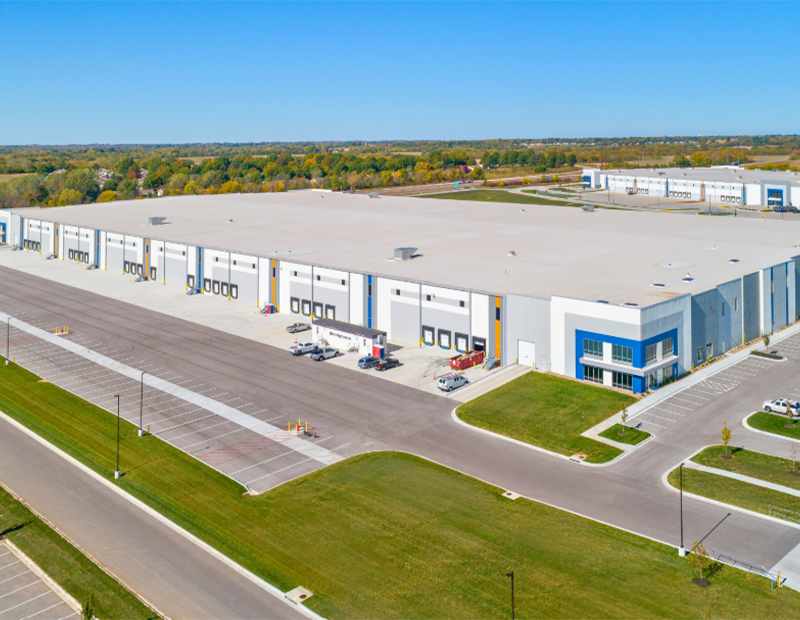
Photo by Marcin Jozwiak on Unsplash
Demand for industrial space has been consistently high since the start of the pandemic and property owners are taking advantage of this when leases expire, the latest CommercialEdge industrial report shows. As a result, lease spreads have increased significantly, and new agreements signed in the past year averaged $9.01 per square foot, or $1.88 more than the average for all leases.
Of the 63 markets covered, 44 had a lease spread of over 10 percent, and 16 markets hovered above the 20 percent mark. Port markets and logistics hubs had the largest spreads, with Los Angeles ($7.26 more per foot) and the Inland Empire ($6.06) recording the highest differences.
READ ALSO: Industrial Leasing Trends for 2023
National in-place rents for industrial space averaged $7.10 per square foot in January, up 690 basis points year-over-year and seven cents more when compared to December 2022. Average in-place rents increased most dramatically in port markets, predominantly Southern California markets, with the Inland Empire (15.4 percent), Los Angeles (11.4 percent), Boston (10.4 percent), New Jersey (9.1 percent) and Miami (7.2 percent) leading the way in this aspect.
In contrast, growth of in-place rents was slowest in Midwestern markets, according to the CommercialEdge report. This is largely attributed to new industrial supply being easier to develop in the region than in port markets, providing tenants a bigger advantage in rent negotiations. St. Louis (2.1 percent), Twin Cities (3.3 percent) and Chicago (3.5 percent) recorded some of the smallest increases, alongside some highly coveted logistic hubs such as Indianapolis (3.4 percent) and Columbus (3.5 percent).
Nationwide, industrial market vacancy clocked in at 4.0 percent in January, a 10-basis point increase from the previous month. The lowest vacancies were found in the Inland Empire (1.6 percent), Columbus (1.7 percent) and Charlotte (2.2 percent).
Supply pipeline especially strong in Southern U.S.
The under-construction pipeline included 691 million square feet of industrial space at the end of January, accounting for 3.8 percent of total stock, CommercialEdge data shows. Planned projects included another 706.6 million square feet, representing 7.7 percent of total inventory. Development activity was concentrated in a handful of markets, with the ten largest pipelines making up close to 40 percent of all the stock underway.
As of January, the Dallas-Fort Worth metro featured the largest active pipeline in the country, with 61.6 million square feet under construction and 7.1 percent of total stock and another 49.5 million square feet in planning stages. Phoenix followed closely with a pipeline encompassing some 52.5 million square feet accounting for 15.3 percent of stock.
Read the full CommercialEdge report.

You must be logged in to post a comment.