


Global
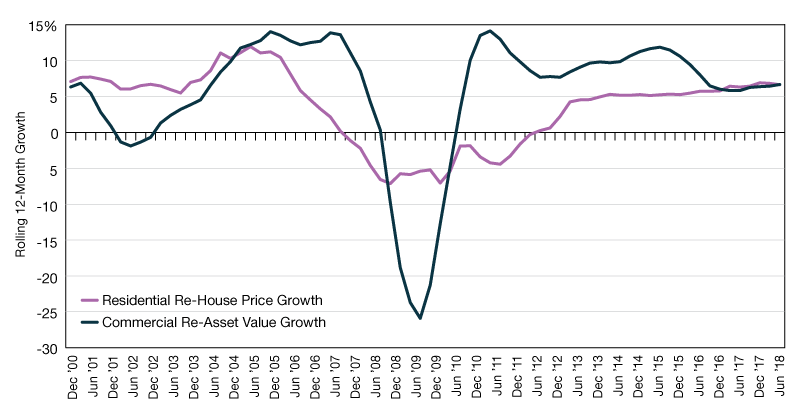
U.S. Commercial vs. Residential Real Estate
The downturn for commercial real estate did not set in until later than for residential real estate but once it did, the shock to commercial markets was much more pronounced.

Country Return Comparison
This chart compares the return performance of seven countries where MSCI has quarterly property indexes for the 12 months ending September 2018.
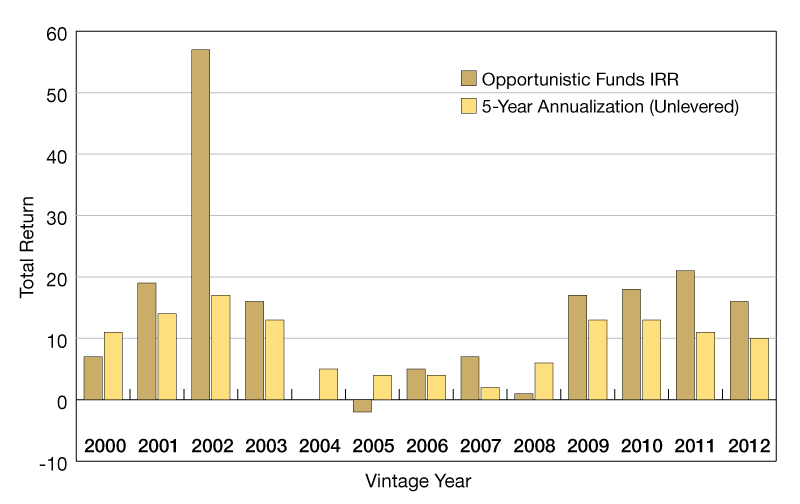
Core and Opportunistic Funds Return
The exhibit compares unlevered asset performance from core open-ended funds in the MSCI database with opportunistic fund performance from Preqin Ltd.

Global Quarterly Property Fund Index
Core open-end funds are one of the most popular avenues for institutional investment into real estate.

Quarterly Total Return
Halfway through 2018, the separation between industrial performance and the returns level of the other core sectors continues to be evident.

U.S. Quarterly Property Index
Most returns have softened since 2015 but the industrial sector has proved more resilient.

Global Annual Property Index
Currency movements can have a big impact on performance as this chart demonstrates.

Annual vs. Five-Year Total Return
Judged on their 2017 total return and five-year annualized performance, the world’s major cities do not stand out, for all their popularity with offshore investors.

Total Return Performance
This chart compares the 2017 total return performance of the 25 national markets in MSCI’s IPD Global Annual Property Index.