

Economic Headwinds Disrupt Office Sector
The latest CommercialEdge office report identified the main challenges hampering the sector’s recovery.
 As hybrid work policies continue to gain popularity among office workers, many major companies’ return-to-office plans are met with pushback, and stagnant office occupancy rates are reflecting this reality. This, combined with rising rates and inflation—which reached levels not seen in 40 years—is further contributing to the office sector’s instability in the short and long term, the latest CommercialEdge office report suggests.
READ ALSO: Class A Demand Stabilizes Office Sector
The office-using sector continues to power through though, having added 99,000 new jobs in May and 532,000 jobs year-to-date. Despite the 2.9 million job openings in the three office-using sectors of the labor market, employment continued its uneven trajectory: Of the 120 top markets covered by CommercialEdge, 44 markets had fewer office-using employees than in February 2020. The Sun Belt ranked first in office-using employment recovery, with Austin, Atlanta, Dallas and Nashville leading the list.
Some 151.2 million square feet of office space was under construction across the nation at the end of May, with 20 percent of the active pipeline located in Central Business Districts (29.9 million square feet), according to the CommercialEdge office report. Once again, Sun Belt markets outperformed the rest of the country, leading the way in terms of construction activity: Austin had 10 million square feet of office space under construction, accounting for 10.0 percent of total stock, followed by Nashville (5.1 million square feet, 8.8 percent) and Miami (5.6 million, 7.4 percent).
Post-pandemic office vacancy patterns
National average full-service equivalent listing rates averaged $37.56 per square foot at the end of May, down 210 basis points year-over-year but 19 cents more than in April. The national office vacancy rate clocked in at 15.4 percent in May, unchanged from the year prior but 30 basis points down from the previous month.
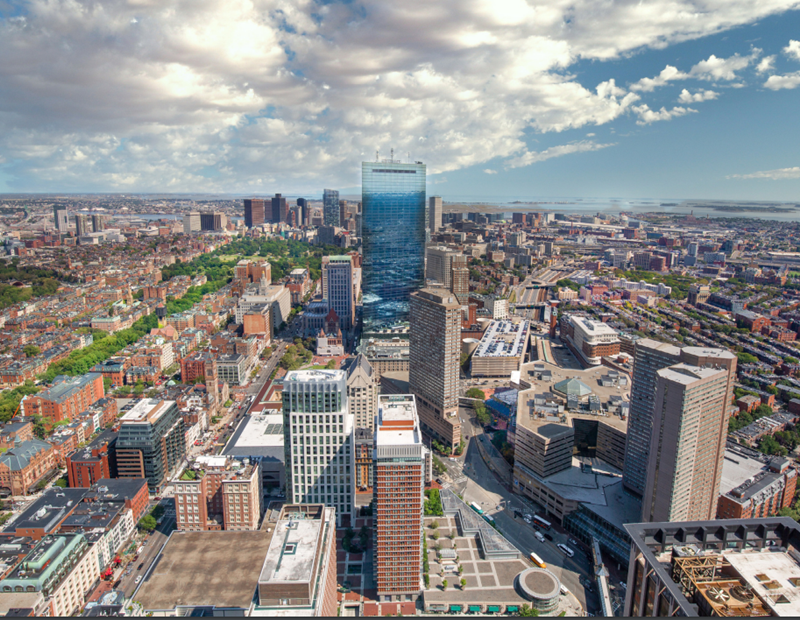
Most markets saw a drop in vacancy throughout the past year, predominantly life sciences hubs, such as Boston (210 basis points decrease year-over-year) and New Jersey (-120 bps) and Sun Belt markets benefiting from pandemic-fueled population growth, including Phoenix (-310 bps) and Miami (-280 bps). Meanwhile, gateway markets including San Francisco and Manhattan had the highest year-over-year increase in office vacancy, at 330 basis points each.
Read the full CommercialEdge office report.


You must be logged in to post a comment.