


San Francisco Office Shows Mixed Performance
The Golden City has exhibited signs of recovery, but some fundamentals have a way to go.
San Francisco’s office sector closed the first half of 2026 with mixed fundamentals, according to Yardi Matrix data.
The metro emerged as the national leader for office prices in June. At the same time, the Golden City recorded the highest vacancy rate in the U.S., despite witnessing a significant drop year-over-year.
As for development, activity contracted, mirroring broader trends for San Francisco office space. The pullback reflects the need to absorb existing inventory before additional projects move forward, particularly following a recent wave of completions. And the Golden City fits that profile, with 3.3 million square feet delivered last year.
San Francisco’s record prices drive climbing dollar volume
San Francisco’s office investment has picked up pace during the first half of 2026. Investors generated $2.4 billion in sales as of June—the third-highest dollar volume in the U.S. Manhattan topped all U.S. markets at $4.3 billion.
The Golden City ranked second for office investment in the peer set, outperforming Washington, D.C. ($1.5 billion) and Chicago ($1.2 billion). In contrast, Seattle’s office sales amounted to only $512 million, the lowest total among the gateway markets.
San Francisco properties sold at $609 per square foot on average in June—the highest value nationally. The metro outperformed Manhattan, where assets traded at $590 per square foot. Additionally, the Golden City’s average was more than double the national $195 per square foot.
Among the other gateway markets, Miami’s prices averaged $404 per square foot, while Seattle’s clocked in at $320 per square foot. Chicago remained the most affordable, with properties trading at $98 per square foot on average.
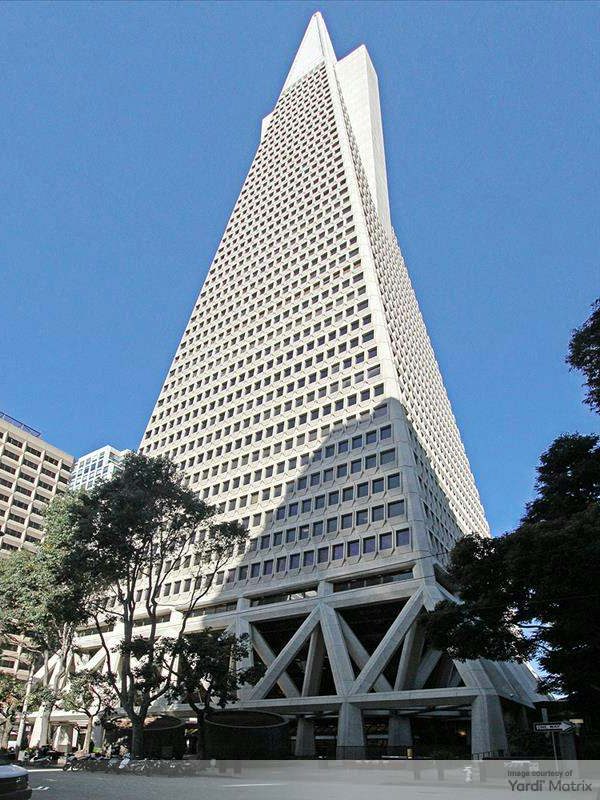
In San Francisco’s largest transaction since 2021, Cyprus-based Yoda PLC paid some $725 million for Transamerica Pyramid Center, a three-building office complex totaling 758,395 square feet in the city’s Financial District. The purchase price also included $34 million allocated for a final settlement with seller SHVO.
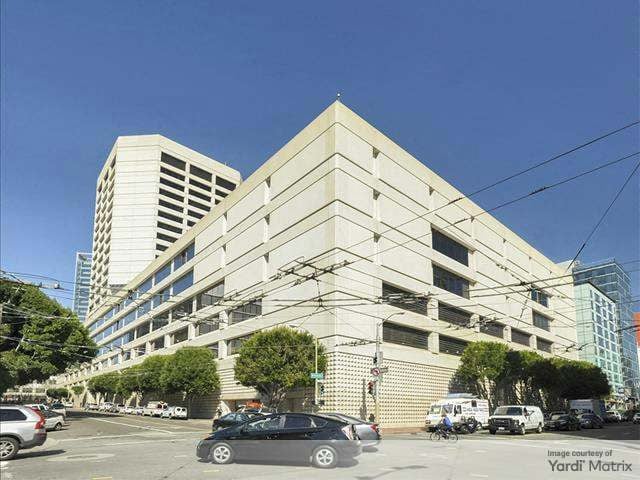
The second-largest deal, amounting to $125 million, closed in March and involved the 345,595-square-foot tower at 123 Mission St. Madison Capital acquired the Class A property from JUUL Labs, with the help of a $70 million acquisition note issued by Affinius Capital.
Pipeline reflects a slower development cycle
As of June, San Francisco developers had 1.5 million square feet of overall space underway across nine projects, marking 0.7 percent of the existing inventory.
When looking at competitive office space, the Golden City had 594,544 square feet in its pipeline. The amount represented 0.4 percent of stock, on par with the national figure.
Boston remained the national leader for competitive space, with 3.4 million square feet underway, followed by Manhattan (2.9 million square feet). On the opposite side, Seattle and Chicago had the smallest pipelines in the country, amounting to 160,130 square feet and 15,910 square feet, respectively.
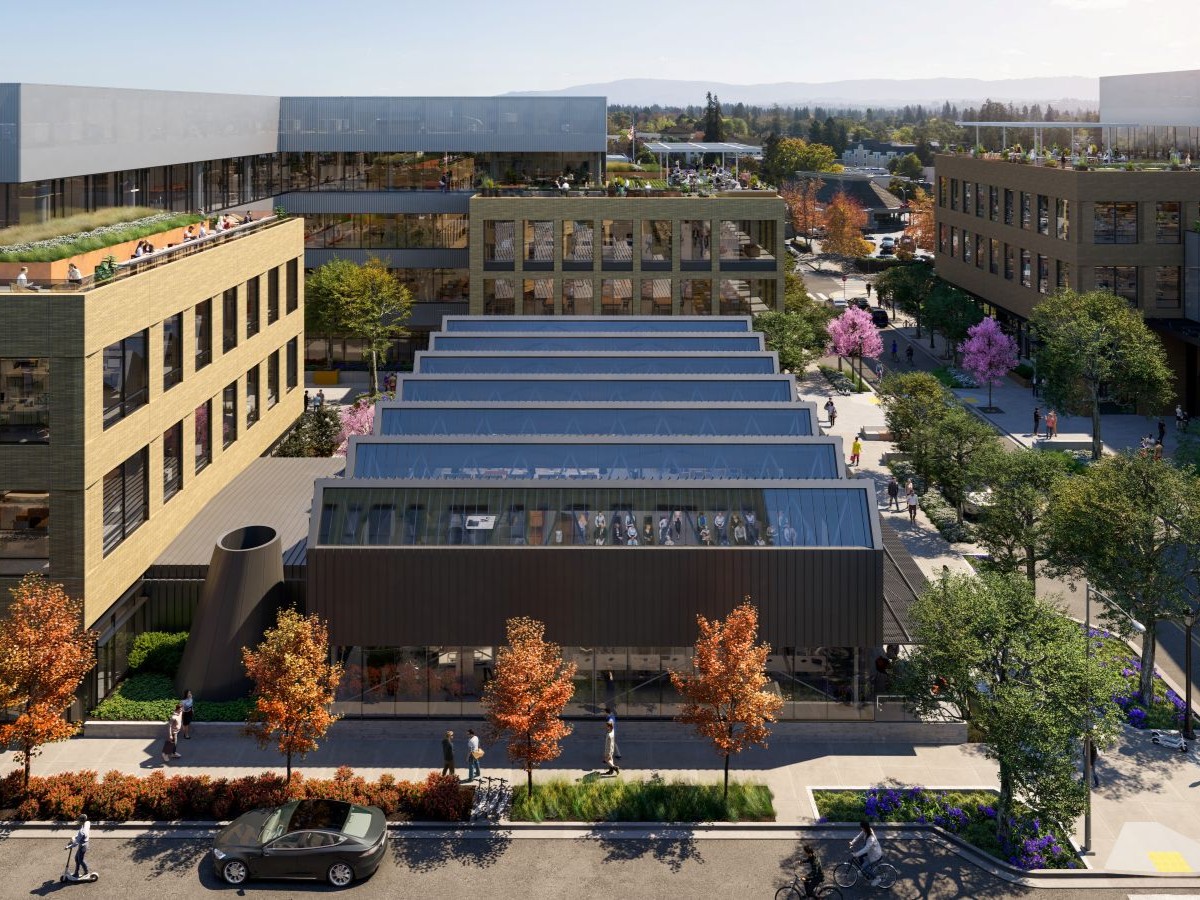
The metro’s top five largest office projects underway total 1.2 million square feet. One of them is The Shop at ELCO Yards, IQHQ’s mixed-use development featuring lab, office and retail space in Redwood City, Calif. The Shop spans 225,000 square feet across four floors and is already fully preleased the Chan Zuckerberg Initiative. The building is slated for completion next year.
READ ALSO: Life Science Sector Faces Vacancy Glut After Construction Boom
The largest development remains Potrero Power Station’s Block 2, a future research facility totaling 278,230 square feet. Developer Fifth Space, formerly known as Associate Capital, started construction in August 2025, with delivery expected in 2029.
The project is also the centerpiece of the $2 billion Dogpatch Power Station redevelopment into a waterfront mixed-use district to include office and life science space alongside retail, hospitality and housing. Upon its completion, the building will house a UCSF precision cancer research center, a primary care clinic and lab space.
Vacancy still elevated despite ongoing recovery
San Francisco’s office vacancy rate reached 25.8 percent in June, down 180 basis points year-over-year but still above the 17.7 percent national average. Despite the notable recovery, the metro had the highest rate in the nation. Manhattan ranked first at 13.1 percent, followed by Miami (13.2 percent).
Seattle had the second-highest rate in the country and also among the gateway markets at 24.7 percent. Washington, D.C. (19.3 percent) and Chicago (17.8 percent) recorded less elevated vacancies in the peer set.
Asking rents averaged $65.13 per square foot, nearly double the $33.67 U.S. figure. The Golden City ranked as the nation’s second-most expensive office market, trailing Manhattan ($72.02 per square foot) but surpassing Miami ($61.04). Chicago remained the gateway city with the most affordable average rents, at $28.39 per square foot.
San Francisco’s largest office lease since 2018 closed at Hudson Pacific’s 1455 Market St., a 1 million-square-foot building in the SoMa neighborhood. The City and County of San Francisco expanded their footprint at the LEED Platinum-certified property by 502,000 square feet, reaching a total of 932,000 square feet.
Flex office maintains stable footprint
The metro’s coworking inventory totaled roughly 4 million square feet across 162 locations in June, according to CoworkingCafe. The amount represented 2.3 percent of the total leasable office space—on par with the national average.
Among gateway markets, the metro ranked sixth for flex office square footage. Manhattan topped the ranking at 12.5 million square feet, surpassing Chicago (9.3 million square feet) and Los Angeles (7.5 million square feet).
WeWork had the largest footprint in the metro at 736,795 square feet. The top five largest flex office providers also included Regus (397,110 square feet), Industrious (375,662 square feet), Studio by Tishman Speyer (256,759 square feet) and Spaces (220,880 square feet).

You must be logged in to post a comment.