Office Report: Vacancies Drive Conversion Boom
High vacancies have sparked 149 million square feet in proposed office conversions, according to the latest Yardi Matrix report.
Record-high office vacancies are opening the door to adaptive reuse, with over 149 million square feet of U.S. office space proposed for conversion—125 million since early 2022, according to Yardi Matrix.

The national vacancy rate stood at 19.4 percent in May, up 160 basis points year-over-year. The data provider’s Conversion Feasibility Index (CFI) identifies top candidates for repurposing, classifying buildings as Tier I or Tier II based on key criteria. Manhattan, despite a lower vacancy rate, has 23 million square feet proposed for conversion, with nearly 55 percent of its office stock rated as Tier I or II. The city launched the Office Conversion Accelerator to support these efforts.
Meanwhile, San Francisco, with a vacancy rate of 28.4 percent and low office attendance, has just 1 million square feet proposed for reuse despite strong CFI scores. To boost conversions, the city is offering tax breaks and launching a revitalization financing district, with projects like the New Humboldt Residences already underway.
READ ALSO: Office Users’ Top Priority Today
As of May, the national office vacancy rate stood at 19.4 percent—down 30 basis points from April but up 160 basis points year-over-year. With office utilization stagnating and job growth in office-using sectors remaining weak, elevated vacancy levels are expected to persist.
Among the metros with the highest vacancy rates were San Francisco at 28.4 percent, Austin at 26.7 percent, Seattle at 25.8 percent, the Bay Area at 25.0 percent, Detroit at 24.0 percent, Denver at 23.6 percent and Dallas at 23.5 percent.
On a national level, full-service equivalent listing rates averaged $33.15 per square foot in May—down 19 cents from the previous month, yet 4.8 percent higher than in May 2024. According to Yardi Matrix, Manhattan posted the highest average asking rate at $68.08 per square foot, followed by San Francisco at $63.01, Miami at $57.71 and the Bay Area at $52.92.
In May, office-using employment declined by 3,000 jobs, largely due to an 18,000-job drop in the professional and business services sector. Although financial activities added 13,000 positions and the information sector gained 2,000, these modest increases failed to counterbalance the overall losses. Over the past year, office-using sectors have expanded by only 1,000 jobs, according to the Bureau of Labor Statistics.
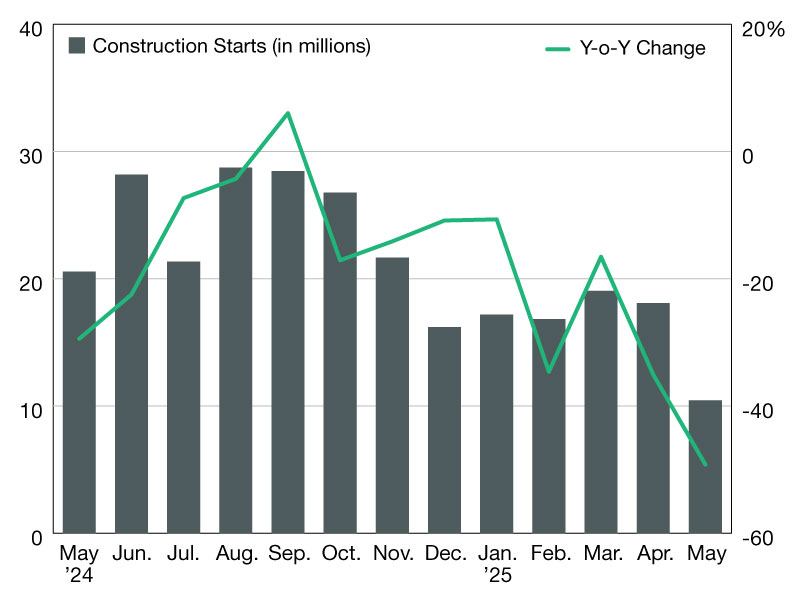
Construction pipeline shrinks as demand softens
As of May, the national office construction pipeline totaled 41.5 million square feet, representing just 0.6 percent of existing inventory, according to Yardi Matrix. Development momentum has continued to taper off in 2025, with only 4.2 million square feet breaking ground in the year’s first five months—a significant drop from the 11.3 million square feet completed during the same period in 2024.
Boston maintained the largest office pipeline in the country, supported largely by life science demand, with nearly 5.9 million square feet underway—equal to 2.3 percent of its total office stock. Dallas followed with 3.2 million square feet under construction (1.1 percent of inventory), while Austin placed third with 2.7 million square feet, accounting for 2.8 percent of its stock.
From January through May, total office transaction volume reached $19.6 billion, with assets trading at an average of $194 per square foot. Manhattan saw the highest investment activity at $2.8 billion, trailed by Washington, D.C., with $2.5 billion, and the Bay Area at $2.1 billion.
Read the full Yardi Matrix office report.
You must be logged in to post a comment.