

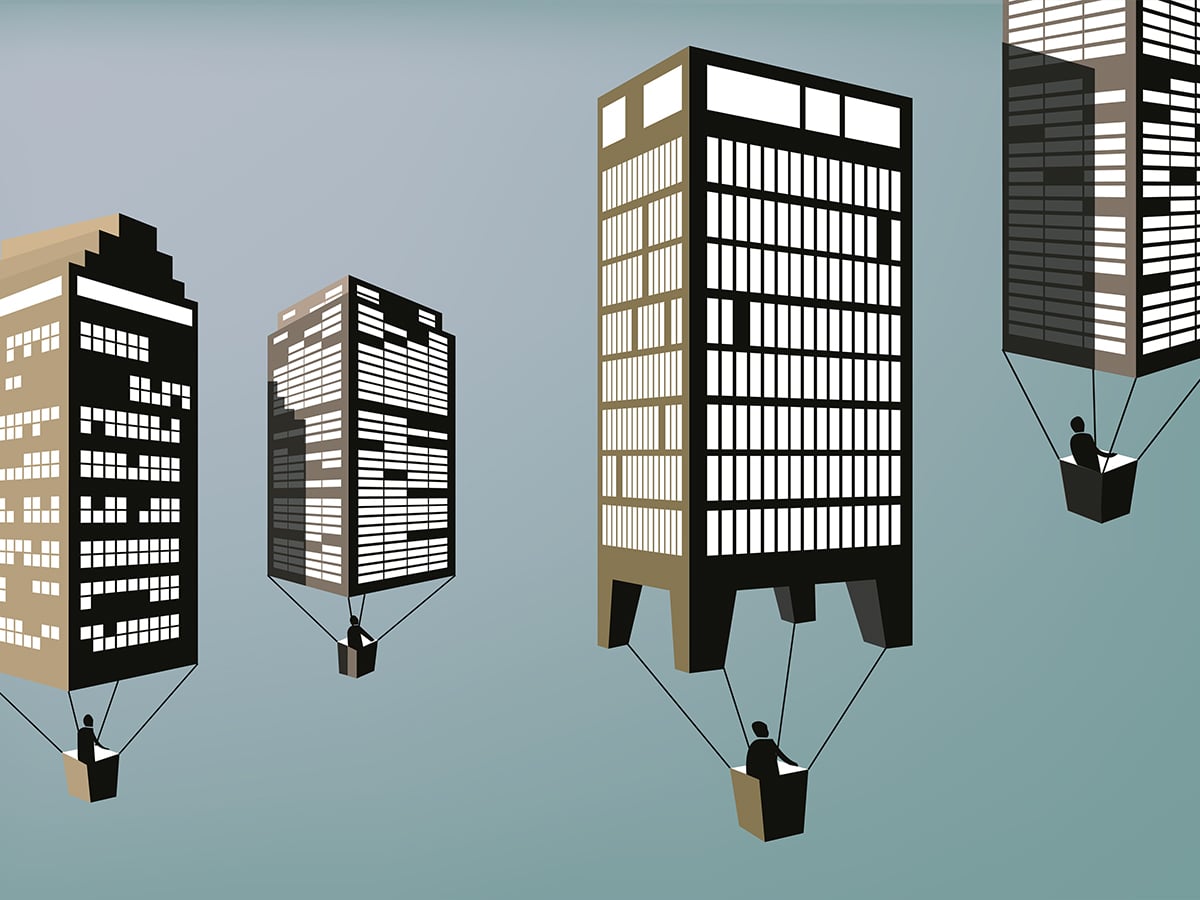
Uncovering Regional Disparities in Remote Work
Office use varies widely across cities and industries, the latest CommercialEdge report shows.
Office utilization and remote work rates vary among different markets, indicating that the impact on the office sector differs across regions, according to the latest CommercialEdge report.

Kastle Systems’ survey shows Texas cities like Austin, Dallas and Houston have higher office utilization rates compared to coastal cities like San Francisco. The American Community Survey reveals that in 2022, 15.2 percent of U.S. workers primarily worked from home, down from 17.9 percent in 2021 but triple the rate in 2019. Boulder, Colo., had the highest remote work rate at 32 percent, followed by Austin, San Francisco, Raleigh, N.C., and Washington, D.C.
Despite Austin’s high remote work rate, it also shows strong office utilization growth due to a significant increase in office employment since 2020. The Household Pulse Survey, covering the 15 largest cities, indicates varying rates of remote work, with Washington, D.C., leading with 52.5 percent of households having at least one member working remotely, while Riverside, Calif., had the lowest at 17.7 percent.
READ ALSO: Has the Return-to-Office Trend Peaked?
The office-using sector added 12,000 jobs in February and expanded by just 0.6 percent year-over-year, trailing the broader labor market’s 1.8 percent growth rate. Some 2,000 jobs were added in information, 9,000 in professional and business services and 1,000 in financial service sectors. Among the 120 markets surveyed by CommercialEdge, 71 experienced a decrease in year-over-year office employment.
The national office vacancy rate clocked in at 17.9 percent at the end of February, a 140-basis-point increase from the same time in 2023. Vacancy recorded the highest increases in Detroit (1,080 basis points), San Francisco (480 basis points), Denver (450 basis points), Seattle (430 basis points) and Dallas (430 basis points).
National full-service equivalent listing rates averaged $37.83 per square foot in February, down 120 basis points year-over-year but 48 cents more than in the previous month. Some of the markets with the highest increases in average in-place rent were Boston (21.5 percent year-over-year), Tampa (8.4 percent) and Miami (5.8 percent).
Boston dominates office construction activity
The under-construction pipeline continued to shrink, with CommercialEdge reporting 94.2 million square feet of new office space underway as of February, which represented 1.4 percent of the total stock. Although venture capital funding for life science companies has slowed and demand softened, lab space development remains prominent. Boston leads the nation in pipeline growth with a 14.5 million-square-foot pipeline, fueled by new lab space. More than two-thirds of the ongoing construction within the metro is primarily dedicated to life science usage.
In San Diego, the active pipeline totaled some 5 million square feet, representing 5.3 percent of total stock. Nashville, Tenn., had 2.7 million square feet of office space underway, or 4.7 percent of stock. San Francisco and Seattle had some 5.8 million square feet of office space under construction, accounting for 3.6 and 4.1 percent of stock, respectively.
Office investment in the first two months of 2024 totaled $3.6 billion. At the same time, the average sale price for a property stood at $179 per square foot. Washington, D.C., spearheaded office investment, amounting to $429 million in total.
Read the full CommercialEdge office report.


You must be logged in to post a comment.