Top 5 Metros for Industrial Deliveries in H1 2025
From desert hubs to Gulf gateways, these markets are shaping the future of the sector, Yardi Research Data shows.
The industrial real estate sector continues to evolve, driven by e-commerce, reshoring and supply chain optimization. Year-to-date through June, developers delivered 149.3 million square feet of new industrial space nationwide—down 35 percent from the 228.3 million square feet completed by the same time in 2024, according to Yardi Research Data. The number of projects also fell sharply, from 993 in 2024 to 595 this year, reflecting a broader market recalibration amid tighter financing conditions and rising vacancy rates.
Yet, with 348 million square feet under construction and 389 million square feet in the planning stages, the sector remains resilient. Developers appear to be recalibrating timelines and focusing on high-demand markets—like the five metros below—where fundamentals remain strong.
Despite the national slowdown, several metros continue to outperform, driven by strategic location advantages, tenant demand and long-term logistics trends. In some cases, deliveries have slowed intentionally to allow absorption to catch up; in others, new markets are emerging as viable alternatives to traditional hubs.
This list highlights the five metros with the highest industrial deliveries in the first half of 2025, based on square footage, provided by Yardi Research Data. While each market tells a different story, they all reflect how industrial development is evolving in response to shifting economic and supply chain dynamics.
1. Phoenix
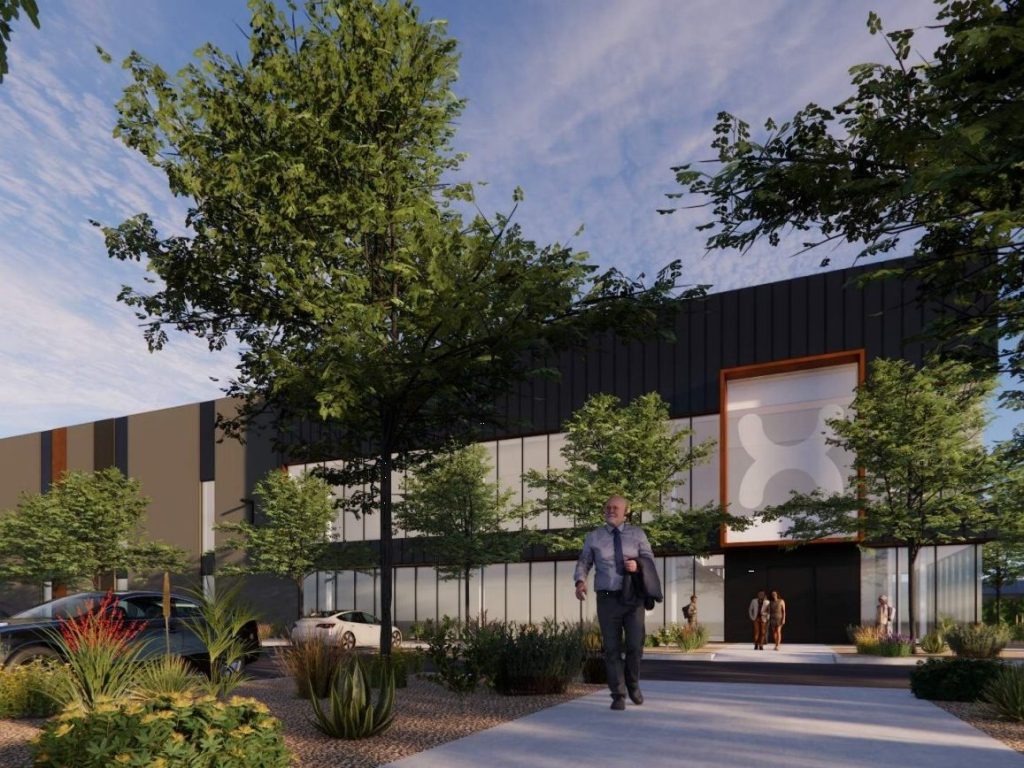
Phoenix leads the nation in industrial deliveries as of the first half of 2025, with 11.2 million square feet completed across 52 projects, Yardi Research Data shows. While this marks a sharp decline from 19.6 million square feet delivered by the same time last year, the metro’s dominance remains intact. The drop reflects a strategic shift rather than a market retreat. Developers appear to be pacing deliveries to match tenant absorption, especially as vacancy rates ticked up in late 2024.
Still, Phoenix’s pipeline is robust: 16.8 million square feet were under construction across 76 projects as of June and 39 million square feet are in planning stages. Construction starts slowed to 6.7 million square feet in the first half of the year, down from 8.8 million last year, suggesting a more cautious approach amid rising interest rates and tighter capital markets. Yet, Phoenix’s proximity to Southern California, favorable tax climate and growing population continue to make it a top-tier logistics hub.
2. Kansas City, Mo.
Kansas City has emerged as 2025’s industrial dark horse. Year-to-date as of June, developers delivered 10.6 million square feet of industrial space across 13 properties—a staggering leap from just 2.9 million square feet at the same point last year. This 260 percent year-over-year increase is the result of targeted development strategies and growing demand for centrally located distribution space. Kansas City’s appeal lies in its access to national freight corridors and affordable land, making it a cost-effective alternative to coastal markets.
Interestingly, construction starts remained minimal—just 1.1 million square feet across two projects—indicating developers are building to demand rather than spec. The under-construction pipeline is modest, with 3 million square feet under construction across eight projects and 5.9 million square feet in planned projects. Kansas City’s performance suggests a market that’s not just growing—it’s being reshaped by logistics operators seeking efficiency and reach.
3. Philadelphia
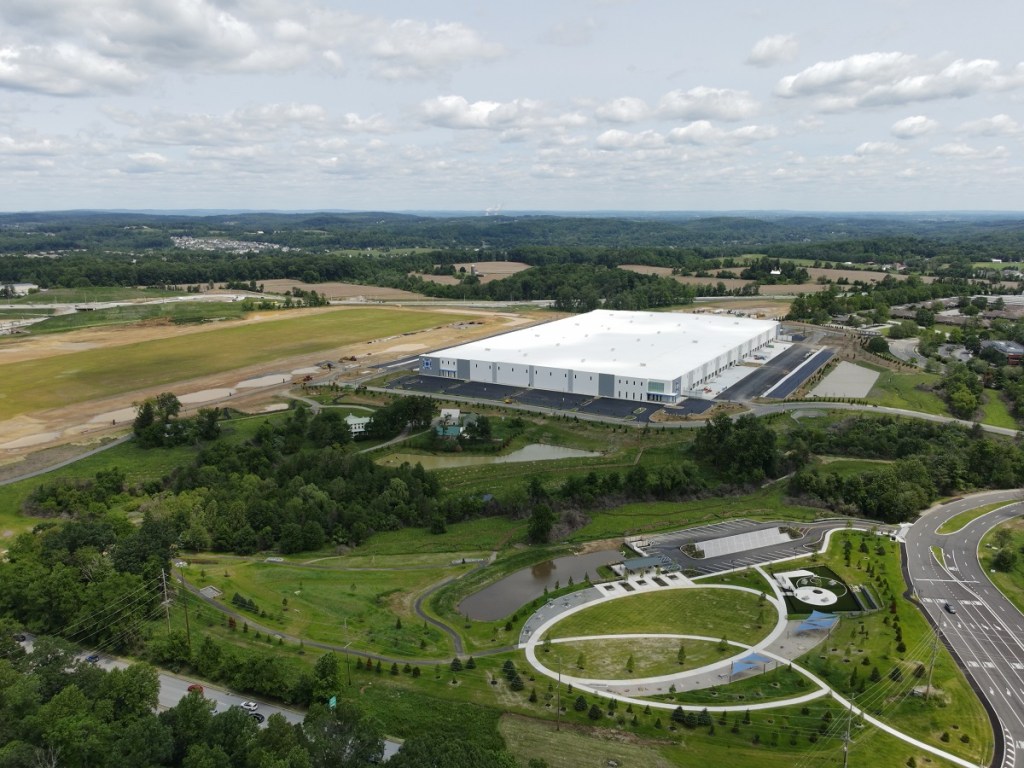
Philadelphia’s industrial sector is undergoing a profound transformation. During the first half of 2025, industrial deliveries surpassed 9 million square feet, up from 2.3 million square feet a year earlier—a nearly fourfold increase. This surge reflects rising demand for logistics space in the Northeast, driven by e-commerce and cold storage needs. The market’s proximity to major ports and population centers makes it a strategic choice for regional distribution.
As of June, the active pipeline totaled 6 million square feet under construction, or 22 projects, and an additional 6.8 million square feet planned, Yardi Research Data shows. However, construction starts have slowed to 1.5 million square feet, down from 7.3 million last year, possibly due to permitting delays or a wait-and-see approach amid economic uncertainty. Still, Philadelphia’s performance signals its growing relevance in the national industrial landscape, especially as tenants seek alternatives to pricier New Jersey and New York City submarkets.
4. Dallas
Dallas saw a significant drop in industrial deliveries in the first half of 2025, with 8.7 million square feet across 48 projects completed, less than half the 19.6 million square feet delivered during the same period last year. The decline likely reflects a strategic pause following years of aggressive development.
Yet, most metrics remain strong: Dallas had 30.8 million square feet under construction across 127 properties and 20.9 million square feet in the planning stages as of June, sporting the largest pipeline nationally. Construction starts rose to 12.5 million square feet through June, up from 8.9 million during the same time last year, suggesting developers are still bullish on long-term demand.
The metro’s location, robust infrastructure and a business-friendly environment continue to attract national logistics players. The current slowdown in deliveries may be temporary, as the market absorbs existing inventory before the next wave of completions.
5. Houston
Houston’s industrial market held steady during the first half of 2025, with 8.1 million square feet across 35 projects delivered, virtually unchanged from 8.4 million square feet one year prior. But beneath the surface, momentum is building. Construction starts jumped to 8.6 million square feet, up from 5.3 million last year, indicating renewed developer confidence.
The metro had 16.7 million square feet under construction as of June and 20.3 million square feet planned, pointing to sustained growth. Houston’s port access, energy sector and expanding population continue to support demand for logistics and manufacturing space. While other markets are recalibrating, Houston is quietly scaling up, positioning itself for a larger role in national supply chains. The consistency in deliveries paired with rising starts suggests a stable market with room to grow.



You must be logged in to post a comment.