

Investment (Research Center)
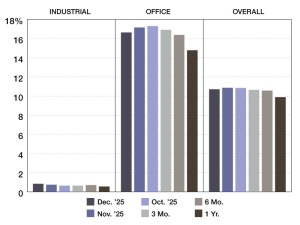

Top 5 NYC Retail Building Sales—December 2025
PropertyShark collected New York City’s top deals for the retail sector.

Top 5 NYC Retail Building Sales in 2025
PropertyShark collected 2025’s top five transactions for New York City’s retail sector.
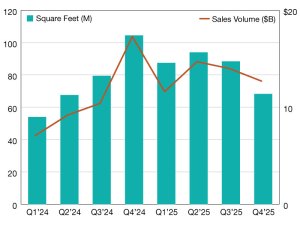
2025 Office Investment Update
Total sales volume has hit new heights, according to Yardi Matrix data.
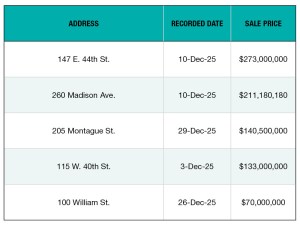
Top 5 NYC Office Building Sales—December 2025
PropertyShark collected New York City’s top deals for the office sector.
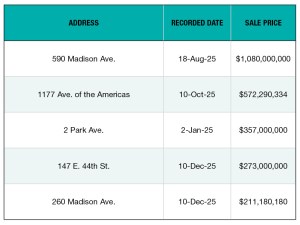
Top 5 NYC Office Building Sales in 2025
These are the five largest transactions in New York City closed in 2025, collected by PropertyShark.

Top 5 NYC Retail Building Sales—November 2025
PropertyShark’s monthly roundup of the city’s top deals.

Top 5 NYC Office Building Sales—November 2025
Here are the top deals for the office sector in New York City, rounded up monthly by PropertyShark.

2025 Industrial Sales Climb Ahead of Year-End
Year-to-date through November, investors closed 4,257 sales totaling $68.4 billion, Yardi Matrix shows.
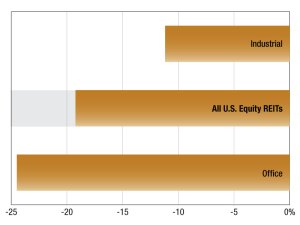
2025 REIT Trading Trends
The latest update on performance from S&P Global Market Intelligence. Read the report.