

Where to Find Tech’s Top Office Submarkets
These areas overachieve on the strength of their talent pools, quality of office space and more, say Vanessa Vogel and Colin Yasukochi of CBRE.

Vanessa Vogel and Colin Yasukochi
Tech needs to be around other tech. That industry dynamic has significant real estate ramifications.
The tech industry thrives through clustering, be it for talent generation and development, product innovation or new company formation. That magnetism has buoyed the office markets of many North American tech hubs through the pandemic and, to a greater extent, the tech-favored submarkets within.
CBRE’s annual Tech-30 report examines the tech industry’s impact on office markets across the U.S. and Canada with a particular focus on these submarkets. In most cases, the tech submarkets examined in the report register better office-occupancy and rental rate growth than the broader office market in their cities.
Specifically, the 30 submarkets—one in each of the Tech-30 cities—carried an average 23 percent rent premium to their overall markets as of mid-2021. Of the submarkets that generated lease-rate growth from mid-2019 to mid-2021, nearly three quarters outpaced their citywide rent growth and 16 submarkets posted lower vacancy rates than their citywide average.
It’s apparent why these submarkets are coveted by tech companies and office investors alike. These areas typically have a higher concentration of tech firms than other parts of the city, are located near major sources of tech talent like local universities or vibrant housing neighborhoods, and command premium pricing from both tenants and investors.
Overall, tech is leading the office-market recovery. The share of U.S. office leasing activity by tech firms surged from 15 percent or 4.6 million square feet in the first quarter of 2021 to an average of 22 percent or 10.2 million square feet during the second and third quarters.
When looking at rental rates, vacancy and net absorption, there were 14 standout submarkets that outperformed their overall market in two or all three of these categories. Compared to their overall market, these standout submarkets had stronger rental growth, lower vacancy rate, and stronger growth in net absorption compared to their overall market. When rent premium is included, where the submarket has rental rates greater than their overall market, there are four submarkets that outperformed.
Here is a look at each:
Top Submarkets for Rent Growth
Lake Union
Seattle saw a 21.9 percent increase in high-tech job growth from 2019 to 2020, placing this market in second among Tech-30 markets. While rent increased 15 percent for the market from Q2 2019 to Q2 2021, rents in the Lake Union submarket increased 24.1 percent. Talent is highly concentrated in the Lake Union submarket, which some of the top names in tech call home. Net absorption in Lake Union increased 3.8 percent during the same period while Seattle declined 3.3 percent. The spread in net absorption growth was the third highest out of all submarkets (Hillsboro in Portland and University City in Philadelphia were #1 and #2).
Oakland/East End
Pittsburgh ranked 12th among Tech-30 markets, but its top tech submarket exhibited some of the strongest growth of all submarkets. Rents in Oakland/ East End increased 34.6 percent from mid-2019 to mid-2021 due to new Class A supply in the market. Tech companies seek this submarket for the talent pipeline streaming from nearby Carnegie Mellon University. Net absorption in Oakland/East End increased 6.4 percent amid a decline for the overall market. Oakland/East End’s growth in net absorption was in the top five of all submarkets.
Tempe
Phoenix ranked 15th among Tech-30 markets, moving up nine spots from the year prior. Tempe has direct access to tech talent from Arizona State University and offers ample Class-A office space. Rents in this submarket increased 13.6 percent from mid-2019 to mid-2021, the fourth highest growth rate of all submarkets. Tempe’s office vacancy in comparison to Phoenix’s marks the second largest spread between any submarkets and its overall market (Philadelphia’s University City). Tempe vacancy sits at 8.9 percent while the overall market is 19.7 percent vacant.
University City
Philadelphia’s University City exceeded the office metrics of Philadelphia itself as well as several other top tech submarkets. This submarket is home to two of the largest universities in the metro: University of Pennsylvania and Drexel University. Rents in this submarket increased 12.8 percent from mid-2019 to mid-2021. The spread in vacancy rates between University City and the overall metro is the largest out of any submarket and its metro. The vacancy rate in University City is 7.7 percent while Philadelphia sits at 18.6 percent.
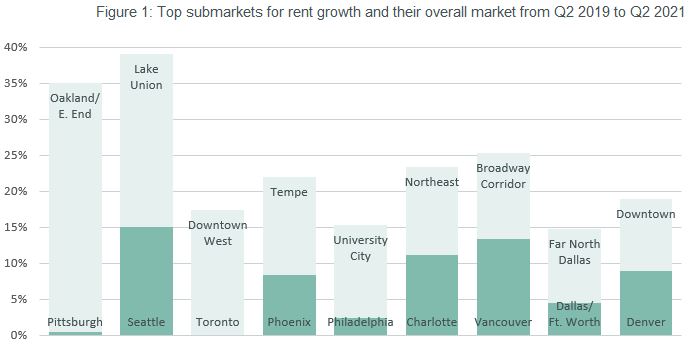
Chart and data courtesy of CBRE
Several other submarkets outperformed their overall market in rental growth or had a lower vacancy rate than their overall market. For rental growth, Oakland/East End (Pittsburgh), Downtown West (Toronto), University City (Philadelphia), Lake Union (Seattle) and Far North (Dallas) were the top outperformers. For vacancy, University City (Philadelphia), Tempe (Phoenix), Ann Arbor (Detroit), Oakland/East End (Pittsburgh) and Lake Union (Seattle) had the greatest spread in vacancy rates between the submarket and their overall market.
These top tech submarkets will continue to outperform their overall market due to the concentration of tech talent, local universities, plentiful amenities and desirable office space. Tech companies are willing to pay rent premiums for these locations compared to other areas within the overall market and these top tech submarkets will lead the ongoing office recovery.
Vanessa Vogel is a CBRE research manager. Colin Yasukochi is executive director of CBRE’s Tech Insights Center in San Francisco.


You must be logged in to post a comment.