EV Boom Reshapes US Industrial Landscape
Fueled by the Inflation Reduction Act, electric vehicle manufacturing is creating a new Battery Belt, the latest CommercialEdge report shows.
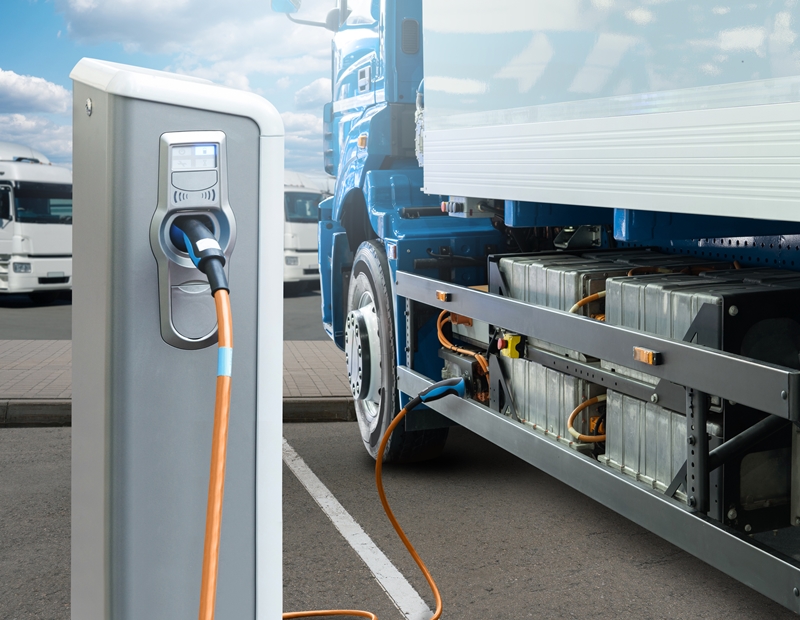
The rising popularity of electric vehicles is driving a significant need for industrial space across the country. Image by Scharfsinn86/iStockphotos.com
The surge in electric vehicle adoption is fueling a nationwide demand for industrial space, the latest CommercialEdge industrial report notes. This includes manufacturing plants for EVs, battery production facilities and extensive supplier networks. While EV sales have faced some challenges in 2023, with swelling inventories and slower growth due to affordability and charging concerns, hybrid-electric and plug-in vehicle sales have seen substantial year-over-year increases. The Inflation Reduction Act (IRA) has played a pivotal role in accelerating EV production, prompting manufacturers to establish new facilities in the U.S., particularly in the Battery Belt region from Michigan to Georgia.
Notable investments—such as Hyundai and LG‘s $4.3 billion plant and Toyota’s $8 billion expansion in North Carolina—underscore the industry’s growth. However, some projects are being adjusted as consumer EV adoption lags expectations. Despite near-term uncertainties, the long-term outlook anticipates robust industrial demand for EV and battery production, driven by the IRA’s incentives and traditional automakers’ substantial investments in the EV market. Supplier networks, exemplified by Epsilon Advanced Materials and Cnano Technology USA, further contribute to the need for millions of square feet of industrial space to accommodate the growing EV ecosystem.
READ ALSO: How to Prepare for an EV Fleet Conversion
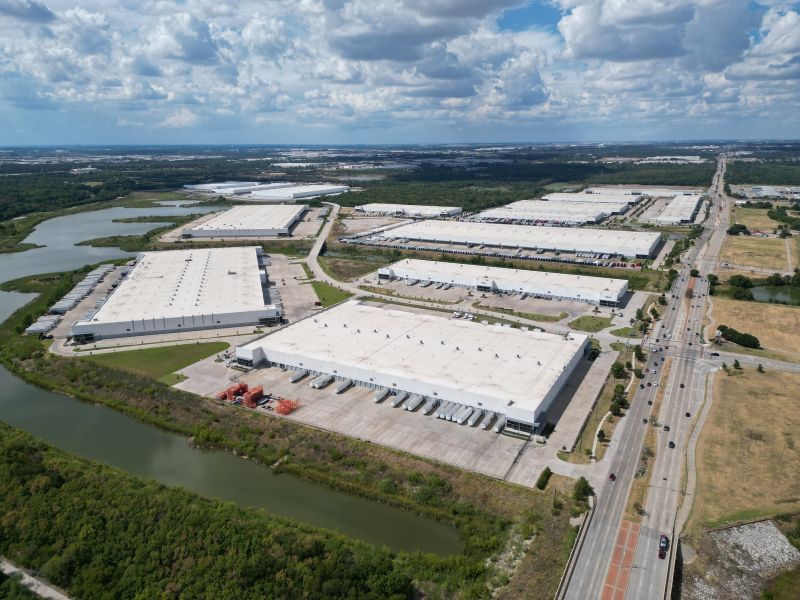
A total of 512.5 million square feet of industrial space was underway at the end of October, amounting to 2.7 percent of total stock, CommercialEdge data shows. While the overall supply of new construction is considerable from a historical perspective, a significant portion is concentrated in a limited number of markets. Specifically, more than 25 percent of the under-construction supply is situated in only five markets, and half of it is distributed across the top 18 markets.
Among these, Phoenix leads the way with an impressive 47.3 million square feet of industrial space underway, surpassing Dallas, the second most active market, which had 42.4 million square feet of space underway as of October. The Inland Empire came in third, with an active pipeline featuring 25.7 million square feet of industrial space. Industrial investment year-to-date in October amounted to $44.4 billion, with properties trading at an average of $131 per square foot.
Stable vacancy rates nationwide
In October, the national average in-place rents for industrial space stood at $7.56 per square foot, according to CommercialEdge data. This marked a notable increase of 760 basis points year-over-year, with a marginal uptick of 5 cents compared to the previous month. Southern California emerged as a dominant force in the national rankings, experiencing significant rental rate growth over the past year. Specifically, the Inland Empire saw a substantial surge in rents, recording a 15.2 percent increase. Orange County, Calif., and Los Angeles followed closely with rent hikes of 12.8 percent each.
Meanwhile, the national industrial vacancy rate remained relatively stable, holding steady at 4.6 percent by the end of October. Examining specific regions, California markets demonstrated some of the lowest vacancies, with the Inland Empire at 4.3 percent, Orange County at 4.6 percent and the Central Valley at 5.0 percent. Additionally, Miami, Bridgeport, Conn., and Phoenix reported low vacancy rates of 4.3 percent, 3.2 percent, and 2.4 percent, respectively.
Read the full CommercialEdge report.


You must be logged in to post a comment.