Capital Markets Trends to Watch in 2H17
CBRE Vice President Brandon Smith identifies the capital markets topics to keep an eye on for the rest of the year.
By Brandon Smith, CBRE
ALL RALLIES MUST COME TO AN END
 U.S. government bonds strengthened in late July as investors continued to dial back expectations for higher inflation and tighter monetary policy. The yield on the 10-year Treasury settled at 2.23 percent on July 21, down from 2.27 percent the day before and 2.32 percent on July 17. Over the past few weeks, there was a change in tone from Federal Reserve officials that was quickly received by the market. The Fed has signaled that low inflation could cause the central bank to raise interest rates more slowly than previously anticipated, and that triggered a 14-day rally.
In addition, European Central Bank officials have also put to rest speculation about an imminent shift toward reduced monetary stimulus. ECB forecasters predict annual inflation in the Eurozone running at 1.5 percent this year, 1.4 percent next year and 1.6 percent in 2019—all below the ECB’s 2 percent target and 0.1 percent below the projections made in April. The report came one day after the ECB held its interest-rate policy and bond-buying program steady. ECB President Mario Draghi also said he didn’t see convincing signs of inflation picking up.
However, it’s a different story this week, as investors took some chips off the table while waiting to process data from the recent Federal Reserve meeting and report on second-quarter U.S. economic growth. Rates spiked again and climbed back up to 2.32 percent, erasing gains from the previous week.
The Fed then announced, as expected, that it wasn’t raising rates this month, but signaled it could start shrinking its bond portfolio by this September. That could have a huge effect on long-term rates. In the meantime, with an uneventful Fed meeting behind them, traders have driven down yields to 2.29 percent as of July 26.
SANTA MONICA – THE MODEL FOR GROWTH?
The population of Santa Monica—one of the most desirable places to live in the country—increased by a mere 6,500 people, or less than 8 percent, between 1960 and 2010. Over the same period, Los Angeles County’s population grew by more than 60 percent.
Santa Monica is split between two entrenched camps when it comes to the politics of growth and housing. The first is the organized pro-growth and pro-housing advocates and the second are the “B.A.N.A.N.A.S.”: Build Absolutely Nothing Anywhere Near Anything. Local residents recently shot down (by 55 percent to 45 percent) a controversial slow-growth ballot initiative. Now the city is debating a new development blueprint for Santa Monica’s downtown known as the Downtown Community Plan (DCP). The surprising thing is they came to a compromise that promises to speed the approvals process for housing developments smaller than 75,000 square feet.
The plan eliminates parking requirements for new construction and boosts the required number of affordable units on the biggest residential projects to 30 percent—an unusually high number. As cities debate how to improve housing, they may reduce parking requirements, but they are going to continue to push for affordable housing , which may slow new starts by increasing construction costs. Portland recently enacted an inclusionary zoning plan citywide that is already having an effect on new construction, and that plan only requires 20 percent affordability.
CHART OF THE WEEK: SUPPLY CONCENTRATIONS
Our research team at CBRE expects completions to reach their peak in early 2018. These completion levels could mean an oversupply in some markets, but other markets need completions to increase to keep up with demand. This is because current economic expansion has been sluggish, leading single-family home construction and the homeownership rate to fall considerably. That means more renters in the market and relatively low vacancies despite the new deliveries. Looking at the total units in the chart below, gateway markets would dominate the list. They represent 30.1 percent of the completions expected through 2019; New York alone accounts for 12.3 percent. However, when you look at secondary markets, the amount of supply varies. San Antonio is delivering 11 percent of its existing inventory compared to Sacramento, which is delivering less than 1 percent.
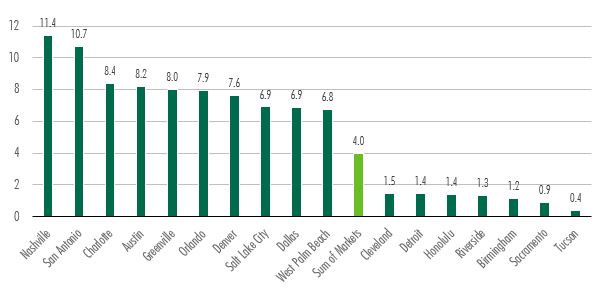
Forecast Completions as a Percentage of Current Inventory (Q2 2017–Q4 2019) Source: CBRE
DON’T CALL IT A COMEBACK
After dealing with pricing volatility and new risk retention rules that went into effect this year, the CMBS market may have found its mojo. In June, lenders issued 451 CMBS loans worth $12.3 billion in debt—twice the value of CMBS loans issued in any other month this year and three times the 135 loans secured in May. Issuances in the first half of 2017 are up nearly 22 percent to $32.3 billion, compared to $25.9 billion in the first half of 2016. In June, $10 billion in CMBS loans matured and were in need of refinancing—roughly $41.7 billion in CMBS debt is set to mature between June and November. While CMBS spreads still don’t compete with terms provided by Freddie and Fannie, a strong market will benefit borrowers because more competition will keep a downward pressure on spreads. We’ve already seen certain banks get very aggressive pricing on single-sponsor securitizations.


You must be logged in to post a comment.