
Carter Phillips

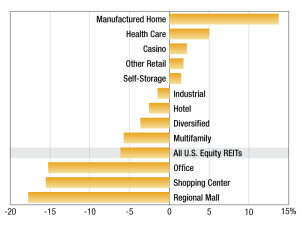
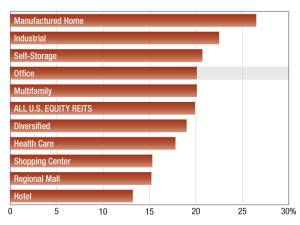
Manufactured Home REITs Out In Front
At the end of May, this sector was clearly outperforming its peers. On an individual basis, however, the best results came from an office company followed by an industrial company, according to S&P Global.
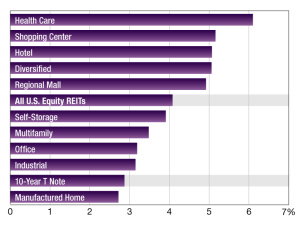
Health Care REITs Outperform
This property type posted the highest one-year average dividend yield in the sector and outperformed the broader SNL U.S. REIT Equity Index by 1.78 percentage points.
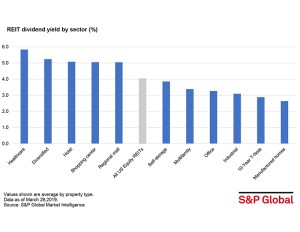
2018 REIT Dividend Yields
S&P Global Market Intelligence measures REITs’ one-year average dividend yield across asset categories, as of November 30.
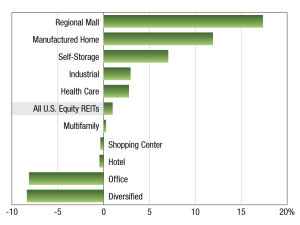
2018 REIT Returns
As of October 31, publicly traded U.S. Equity REITs posted a 0.98 percent one-year total return.
2018 REIT Trading Trends
As of Sept. 28, publicly listed U.S. equity REITs traded at a median discount to consensus net asset value of 6.14 percent.
2018 REIT Values
The multifamily sector had a 20.1x last 12 months funds from operations multiple as of Aug. 31, outperforming the broader US REIT index and six other REIT sectors.